Case Study 2 - Lab Scientist doing computational work
Last updated on 2026-05-14 | Edit this page
Estimated time: 14 minutes
Overview
Questions
- What are the main carbon emission sources for a researcher conducting computational data analysis?
- How do data storage choices impact long-term carbon emissions in research projects?
- What are the trade-offs between using different LLM models for generating research code?
- How can hybrid storage strategies reduce carbon emissions while maintaining data accessibility?
Objectives
- Estimate carbon emissions from data storage, LLM usage, and computational processing using appropriate methodologies.
- Compare the carbon footprint of different storage technologies and LLM models across project timescales.
- Evaluate the relative contribution of different activities to total research emissions and identify priorities for intervention.
- Design an improved workflow incorporating cold storage strategies and appropriate LLM selection to achieve significant emission reductions.
Introduction
Emma is a researcher in a biology lab and was tasked with analysing genomic sequencing data. While she is an expert in molecular biology, her computational and statistics background is limited. Due to the type and volume of data generated in the lab, she chose to write custom Python scripts to analyse her data. The project Emma is working on is scheduled to run for 5 years.
Emma’s set up:
- Work laptop: modern and energy efficient laptop
- Data storage: Her research will generate approx 3.5 Tb of raw data for the duration of the project. There will also be additional processed data products that she will work with regularly.
Emma’s current workflow:
- She uses cloud-based LLMs to write her scripts for processing and analysing data. This often requires many queries and iterations.
- She keeps every version of her raw data on the HDDs, and rarely deletes old files.
- After pre-processing the raw data, she stores a copy of the processed data on different HDDs.
- She runs her scripts on her laptop and scripts often take 6h to complete.
Emma is interested in reducing her digital carbon footprint and wants to optimise her computational workflow to balance scientific rigour with environmental responsibility.
Collecting information
What data does Emma need to understand the emissions associated with her software?
- What are the key aspects of her work that Emma could estimate emissions for?
- What methodologies could Emma use to estimate her emissions?
- What additional data would she need to collect in each case?
- Data storage. If Emma has particular storage devices in mind she could look for PCF reports to get the embodied emissions and possibly a usage estimate. Such data is less readily available for storage devices however. In the absence of PCF data Emma could used some of the emissions estimates from sources such as those covered in episode 3. She will need to know the volume of data and the amount of time she’ll need to store it for.
- Use of LLMs. Tracking which model she uses, and how many queries she sends and the approximate size of the replies for use with the Hugging Face Ecologits calculator.
- Data processing. Looking for a PCF data sheet for her laptop will provide information about the embedded emissions. For the operational emissions she could choose between direct measurement with a power meter, use of a tool like codecarbon or estimation with the Green Algorithms Calculator. In the known context that operational emissions of laptops are low, it’s probably easiest to use the lowest effort method of the Green Algorithms calculator. She can always follow up with a more accurate method later if the initial estimate seems significant. To do this she’ll need an estimate of the CPU utilisation of her laptop and its specifications.
From her planned set of experiments and the a set of trial runs with the lab equipment Emma estimates that she’ll produce a total of 3.5 Tb of raw data. Her project is due to run for 5 years and there is a 10 year data retention period afterwards to comply with her funding’s conditions.
Based on her domain knowledge and previous experience she estimates that in addition to the raw data there will be around 400 GB of processed data products for each year of the project. These will be the main data used for her analyses which will take some time to complete and which she may want to revisit frequently.
LLMs use
Emma primarily interacts with an LLM via a browser chat window. She hasn’t paid much attention until now about which model she is using or how much she uses it. Checking now, the default model is GPT-5.4. She also keeps track of her usage during a session and finds that she sends 30 queries.
Running processing and analysis scripts
Emma is using her modern laptop and looks up the specifications for her model to get more accurate emissions. She finds that her laptop has a Core i5-1145G7 processor, with 4 CPU cores and 64 GB memory. Her analysis scripts are not parallelised so can only use up to 1 core. As she often leaves her scripts running overnight she’s not sure exactly how long they take. For the next run she does she adds a command to record the total runtime which is 6 hours.
Analysis
The analysis section is split into two parts:
Have attendees complete the “Emissions from Emma’s current workflow” challenge. This is best done in groups. Have attendees report back on what they’ve come up with.
Then have attendees open the spoiler tag - “Emma’s estimates”. This section provides the “canonical” outcome of Emma’s emissions estimates and further develops the scenario so that reductions in emissions can be considered. Recommend that the groups from above look through the section together and complete the embedded challenge.
Emissions from Emma’s current workflow
Based on the information Emma collected, what are the estimated emissions associated with her current workflow? What is the largest contributor to emissions out of Emma’s activities?
It is easier to split Emma’s workflow into three main activities associated with carbon emissions: data storage, LLM use to write scripts and running her scripts.
- data storage: Work out how much data Emma will produce for the duration of the project. This should include back up data and processed data.
- LLM use: use online tools like HuggingFace’s Ecologits calculator to estimate emissions per query.
- running scripts: use online tools such as the Green-algorithms calculator to find the emissions emitted by her laptop
- Data storage:
Emma’s research will produce 3.5 TB of raw data for the duration of the project. Because she keeps two copies of all raw data, the total required storage for raw data comes to 7 TB. Beyond that, Emma will generate an additional 400 GB of processed data per year, adding up to 2 TB over the duration of the project. Altogether, Emma will need 9 TB of storage to keep both raw and processed data.
However, the data retention policy of 10 years beyond the end of the project means that the data must be stored for a total of 15 years. Given that the lifespan of HDDs can reach 10 years in best case scenario, Emma will have to replace the HDDs at least once.
\[ E_{HDDs} = E_{embodied}+ E_{operational} \\ E_{HDDs} = (3 kgCO₂e/TB \times 9 TB + 9 kgCO₂e/TB \times 9 TB) \times 15 \\ E_{HDDs} = 1,620 kgCO₂e \]
Storing the 9 TB data on HDDs will have associated carbon emissions approximately equal to 1,620 kgCO₂e in combined embodied and operational emissions, based on the average values within the emissions ranges she identified.
- LLM usage:
Emma consults HuggingFace’s Ecologits calculator tool. It doesn’t have specific data for GPT-5.4 so uses the generic GPT-5 model estimate. She uses 30 as the number of queries but is not sure of the number of tokens that have been returned. She decides to use the largest response size (15000 tokens) with the understanding that this is an overestimate. This gives a emissions of 10.8 gCO2e per query and running 30 queries generates 0.324 kgCO₂e. She considers this to be an upper bound estimate of the emissions per session. She also notes that this estimate doesn’t include emissions from model training. Assuming an average of 1 session per week over the 5 year course of the project that gives a total of 84 kgCO₂e.
- Running scripts:
Using the Green-algorithms calculator with her CPU model running for 6 hours with 1 core to find that the emissions emitted by her laptop - 53.20 gCO₂e each time. If she runs the similar analyses weekly over the 5 year course of the project, the total emissions would be 13.78 kgCo2e.
Greatest source of carbon emissions
Based on the calculations above, storing research data and using LLM’s are the activities with the largest associated carbon emissions. At around 1,700 kgCO2e these activities account to a quarter of the emissions per-capita in the UK,according to the International Energy Association. While lower in comparison, the emissions linked to using LLMs to help write her code are not insignificant and are equivalent to charging a smartphone nearly 7000 times. With this in mind, Emma begins developing an improved research workflow to reduce her digital carbon footprint.
Taking action
Similarly to above, the below challenge can be tackled collectively and attendees can report back on their results.
The following spoiler section then rounds out the scenario and provides a “canonical” outcome. Suggest that the below “outcomes” section is delivered to all attendees.
Emissions from Emma’s improved workflow
Based on the results of the carbon emissions associated with Emma’s current workflow, consider the following:
- What is the simplest change Emma can make that would have the highest impact on her carbon emissions?
- How does that compare with other activities that Emma might be doing?
Emma can improve her data storage strategy and use LTO-tape based facilities for cold storage and HDDs for data processing. She could also use a simpler LLM model.
Data Storage Changes
She has heard that her institution provides a tape-based cold storage options located in two different campuses and which are intended for data that is not accessed very often. She decides to keep the two copies of the raw data on the LTO-tape based storage provided by her institution, with each copy being stored at a different site. This ensures the data is safe in case something happens with one of the storages. She decides to keep her processed data on HDDs, as she needs easy and fast access for analyses.
Based on the information she gained, Emma adopts a new workflow:
- She switches to GPT-40-mini however after some experimentation she finds that her sessions now average closer to 50 queries.
- She keeps the two copies of raw data (7 TB) in the LTO-tape based facilities provided by her institution. She keeps the processed data (2 TB) on HDDs for active work.
Challenge
Given all we know about Emma’s new workflow, calculate the emissions associated with Emma’s work. How do they compare to Emma’s previous workflow?
- data storage: part of Emma’s workflow would be stored on LTO-tape and part on HDD This should include back up data and processed data. Given that magnetic tape has negligible emissions when idle, we can assume that the total emissions from storing data on tape come from embodied emissions, estimated at ~0.07 kgCO₂e per TB.
- LLM use: use online tools like HuggingFace’s Ecologits calculator to estimate emissions per query.
- Hybrid data storage:
Given that magnetic tape has negligible emissions when idle, we can assume that the total emissions from storing data on tape come from embodied emissions, estimated at ~0.07 kgCO₂e per TB. Keeping the two copies of raw data (7 TB) in the institution’s LTO‑tape storage facilities would therefore generate:
\[ E_{tape storage} = 0.07 kgCO₂e/TB \times 7 TB \times 15 years \\ E_{tape storage} = 7.35 kgCO₂e \]
Keeping the 2 GB of processed data on HDDs would generate:
\[ E_{HDDs} = (3 kgCO₂e/TB \times 2 TB + 9 kgCO₂e/TB \times 2 TB) \times 15 years \\ E_{HDDs} = 360 kgCO₂e E \]
Therefore, the total costs associated with storing Emma’s research data would be 367.35 kgCO₂e.
- Simpler LLM model:
Emma is planning to switch from a reasoning model to a smaller LLM model, GPT4-0-mini, for which emissions are estimated to be around 562 mgCO₂e per query.
\[ E_{LLM} = 0.562 gCO₂e/query \times 50 queries \times 52 weeks \times 5 years \\ E_{LLM} = 7.3 kgCO₂e \\ \]
The total emissions associated with using the simpler LLM would be approx. 7.3 kgCO₂e.
A comparison of the emissions associated with both scenarios can be found below:
| Scenario 1 (Current Workflow) | Scenario 2 (Improved Workflow) | Change | |
|---|---|---|---|
| Emissions Storage (kgCO₂e) | 1,620 | 367.35 | HDDs only -> LTO tape + HDDs |
| Emissions LLM (kgCO₂e) | 84 | 7.3 | GPT-5 -> GPT-4-o-mini |
Outcomes
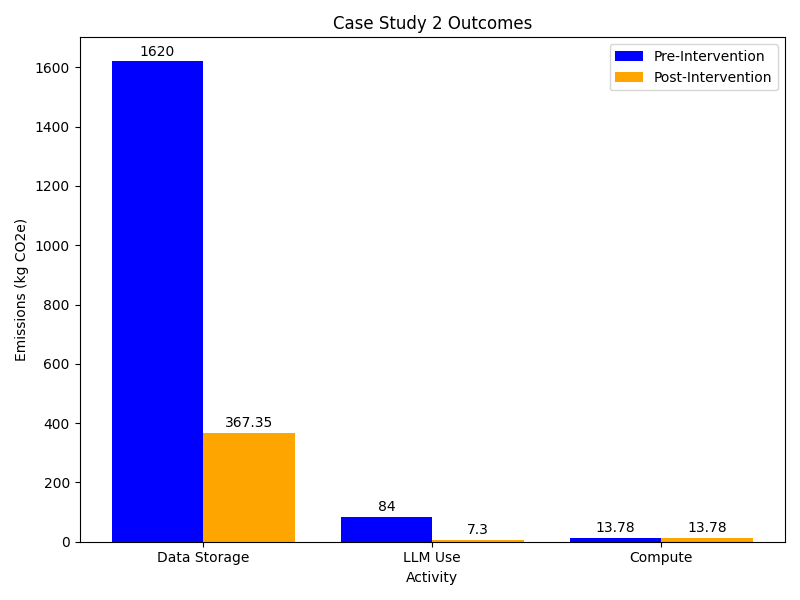
Adopting the improved workflow would result in a five-fold reduction in Emma’s digital carbon emissions. Particularly, moving from storing data on HDDs to a hybrid storage approach that includes both HDDs and LTO-tapes has the greatest impact on lowering emissions, saving around 1,250 kgCO2e, which is equivalent to the total annual electricity-related emissions of three average UK households.
While these improvements are substantial, they represent only one piece of a larger puzzle. For a life scientist, the total work-related emissions typically range from 4 to 15 tCO2e annually 2. These numbers are driven by carbon intensive activities, such as international travel, laboratory heating, ventilation and AC systems, and the heavy use of chemical reagents and single-use equipment. Emma therefore also resolves to look at her lab based research activities for emissions reductions.
Further reducing Emma’s emissions
Identify additional strategies that Emma could implement to further minimise her digital carbon footprint.
- Schedule to run her scripts for then the grid is cleanest
- Use compression technique to further reduce the size of her stored data
- Identify and delete dark data (data that is stored but never used again)
- Process the data before uploading to cloud to reduce storage requirements
- Change which LLMs models she uses based on the task complexity
- Make use of tools such as EcoLogits (open-source Python library to estimate the carbon footprint of inference queries made to LLMs) and online LLM carbon emissions leaderboards
References
- Winter N,The paradox of the life sciences: How to address climate change in the lab: How to address climate change in the la. doi: 10.15252/embr.202256683
- Woo, N.H. A comparative study of AI and human programming on environmental sustainability. Sci Rep 15, 39182 (2025). https://doi.org/10.1038/s41598-025-24658-5