
Case Study 1 - Research Software Engineer
Last updated on 2026-07-29 | Edit this page
Estimated time: 60 minutes
Overview
Questions
- What are the main sources of carbon emissions in research software development and deployment?
- How can a Research Software Engineer measure and estimate emissions from software development, CI/CD workflows, LLM usage, and software execution?
- What strategies can reduce carbon emissions from widely-used research software?
- How do emissions from software usage compare to emissions from software development?
Objectives
- Collect and organize data needed to estimate carbon emissions across the software development lifecycle, including development, testing, and user execution.
- Calculate carbon emissions from different activities using appropriate tools.
- Analyze emissions data to identify the most significant sources and prioritize reduction efforts.
- Design and implement emission reduction strategies including code optimization, improved user documentation, and better error handling.
Scenario

Celia is concerned about the environmental impact of her software package. She wants to assess the carbon emissions associated with both the development and usage of her package and identify ways to reduce these emissions.
Celia should assess the balance of emissions involved in development of the code base versus its usage. She should look at how to estimate these then focus her emission reduction measures appropriately.
Collecting Information
Data exploration (20 minutes)
Celia decides to learn more about each of the emission sources, she inspects the following areas of her work:
- Development of the software package
- Use of GitHub Actions for continuous integration and testing
- Use of LLMs (online)
- Execution of the software by end users.
For each of these areas, how could Celia estimate or measure the associated emissions? What data would she need to collect in each case?
- Remember to consider both the embodied and operational components of the emissions.
- Depending on the information she is able to collect some methodologies may be impractical.
- Consider how carbon intensity values should be used.
Software Development
- Celia should consider all of the hardware that she uses to develop her software.
- For the embodied emissions she should consider the source the device (was it newly purchased, refurbished, inherited from another group member?), its age, and try to get information from the manufacturer’s Product Carbon Footprint (PCF) datasheet.
- For the operational emissions, if using local hardware, Celia could use a power meter to measure the power used during development. Given the general skew towards embodied emissions in consumer devices though its less important to be precise with this value. Bearing this in mind she could use a simpler method to estimate such as the Green Algorithms Calculator, or taking a proportion of embodied emissions. In any case it would be useful to track how much time she spends doing development and the amount of computational work involved. She can use the measured or estimated power usage with a local carbon intensity value to get emissions.
GitHub Actions
- Celia should check where her workflows are running. If using self-hosted runners it may be possible to get information about the hardware and utilisation. More likely however in the case of GitHub hosted runners it will be difficult or impossible find to such information.
- One data point that is easy to collect is the total runtime of her workflows over a given period. Using assumptions about hardware and utilisation she could use this with the Green Algorithms Calculator but these values would be very approximate and would not account for embodied emissions.
- ECO CI is a specialist tool that could be added to her workflows to get better estimates with less work!
LLM Use
- The simplest method would be to use the Hugging Face Ecologits calculator. The key information to track here is which models are used and ideally the number of tokens generated during use. In practice, getting token counts is not straightforward so tracking the number of queries and the length of the responses would be sufficient.
- One alternative might be to make some assumptions about the amount of compute required per response and the hardware used and plugging this into the Green Algorithms Calculator.
- Another alternative might be to run a local LLM and measure the power usage but this would be a lot of work and of dubious accuracy.
- Note that none of the above methods account for training emissions. In practice there is poor data available for this and it’s not clear what proportion of the training emissions it would make sense to associate with Celia’s usage.
Software Usage
- In order to make comparable estimates for both her local and the remote groups’ usage Celia should try and use a consistent methodology for both.
- She could measure the energy usage (using a power meter or codecarbon) from some local runs and use this as a basis for estimating remote runs (assuming they’re running on similar hardware).
- Alternatively, as she is likely to be making a lot of assumptions anyway she could use the Green Algorithms Calculator to get ballpark estimates for local and remote usage. She will have to consider carefully what carbon intensity value(s) to use, assuming an average may make the most sense.
- In either case she should collect as much information as possible about the hardware being used for both local and remote usage as well as information about how often the software is run and for how long. It should be relatively easy to get this information for local usage and she may be able to get information from some remote users.
- Similarly, for embedded emissions she could assume the local hardware to be representative of the remote usage or use some generic average values. Practically, as the software may be used on a variety of hardware, she could also treat embodied emissions as out of scope.
Analysis
Estimating emissions (20 minutes)
Initially Celia decides to use some simple estimation methodologies with some readily available data. Using the information and methodolgies provided below produce an estimate for the carbon emissons for each of Celia’s activities.
Software Development
- Celia exclusively uses a laptop for development - an HP EliteBook 840 G9 - that was newly purchased for the project. She estimates that she uses it for around 20 hours per week for software development intermixed with other tasks.
- The development process is not particularly computationally intensive as she mostly works with an Integrated Development Environment and runs the test suite occasionally.
Use the PCF sheet for the laptop and the Green Algorithms Calculator to estimate the emissions associated with software development. You will have to make some assumptions and decide how to deal with the mixed use of the laptop.
Use of GitHub Actions
- Celia’s workflows run on any push to a branch, when a pull request is opened and when a release is created.
- The workflows run on GitHub hosted runners.
- Looking over the last week, all of her workflows together have a runtime of around 2940 seconds.
- She adds ECO CI to her workflow and notes that the estimate for a workflow that runs for 500 seconds is around 1 gCO₂e (including both operational and embedded emissions).
Use the ECO CI value to estimate emissions for all of Celia’s workflows.
Use of LLMs
- Celia uses GPT-5 mini for creating inline documentation for her code.
- On an average, she writes approximately 20 prompts to the agents every week.
- This particular agent typically provides short responses.
Use the Hugging Face Ecologits Calculator to estimate emissions for her LLM queries.
Use of the Software Package
- Members of Celia’s research group are users of her package. They are able to provide her with the full specification of the machine they are using - an [HP Z2 Tower G1i Workstation]. They run the package for around 18 hours a week using all the 20 cores.
- From individuals she’s in contact with, conversations she’s had at conferences, mentions in academic papers and a workshop she ran recently, Celia estimates that her code has around 30 regular users outside of her own research group.
- For the other users of her package, it is difficult to get detailed information on their level of usage or hardware.
Using the Green Algorithms Calculator estimate the emissions from execution of the software package.
- You will have to make some assumptions in order to make some calculations.
- When calculating the contribution from embodied emissions of the laptop how can you account for the mixed use of the device?
- If the CPU model is not available in the Green Algorithms Calculator then you can choose “I can’t find my CPU” and provide the requested hardware specifications.
- What assumptions could you make to estimate emissions from users of the package outside Celia’s research group?
- To allow comparison, aim for emissions estimates over a consistent time period for each category.
Celia’s estimates for the emissions from different activities are as follows:
Hardware emissions
- The PCF datasheet for the HP EliteBook 840 G9 gives a total of 176 kgCO₂e. Assuming a 5 year lifespan of the laptop and a total weekly usage of 40 hours she calculates the weekly proportion of embodied emissions to be 338 gCO₂e.
- The Green Algorithms calculator doesn’t have data for her exact CPU model so she looks up the Thermal Design Power of the processor and provides it. To get the CPU utilisation she decides to err on the side of caution and assume her development activities use a full CPU core for the full 20 hours she spends developing. This provides an estimate of 58 gCO₂e of operational emissions per week.
Emissions from GitHub Actions
- Given she has an estimate for a workflow of 500 seconds she chooses to simply scale this up to the full runtime of 1640 seconds. This gives an estimate of around 6 gCO₂e per week.
Emissions from LLM usage
- Using the Hugging Face EcoLogits calculator Celia estimates the emissions from her weekly LLMs usage to be around 1 gCO₂e.
Emissions from the users of the software package
- Celia has enough details to estimate her groups activities using the Green Algorithms calculator. Doing this for the known runtime and hardware of her research group this provides an estimate of 569.61 gCO₂e per week.
- To estimate the impact of other users of her software she could consider using this number as a reference although it might make for a pretty rough estimate. This would give an estimate of around 17 kgCO₂e per week of operational emissions.
- Celia decides to leave out the embodied component of the analysis as she doesn’t know enough about what hardware is being used to run her code.
Taking Action
From the estimates Celia has made it’s clear that the emissions associated with usage of her package are the most significant. She also anticipates these growing over time given the growing popularity of her package. The emissions from GitHub actions and LLM usage are negligible.
Measures to reduce emissions (20 minutes)
Celia identifies several ways she can improve the emissions associated with usage of her code base as mentioned below.
In your groups discuss any other measures you think could be implemented and what impact they might have. What steps could Celia take to get better data to refine the emissions estimates she’s made so far?
Code Optimisation
- Celia uses a profiler with her code to identify areas where the code could be optimised. She identifies the areas of the code where the bulk of the computation is performed. After some experimentation she finds a way to improve use of SIMD in a key calculation.
- Furthermore, she replaces the use of the
pandaslibrary withpolarsand reverses the order of a conditional statement and a loop deep within the code, so that the former is not checked several times unnecessarily. In her tests this gives a 7% performance boost to the code. - Her code also runs in parallel across multiple cores. Her profiling helps her to identify that work is not being evenly distributed between cores leaving some cores idle whilst they wait for others to finish. She implements a new algorithm to partition work between the cores and with an overall 10% improvement in runtimes.
- Combined these steps reduce the computational resource usage of her code by 17%.
User Support
- The users of her package (members of her research group) have been asking her for help with optimising the performance of the code. She provides them with some tips on how to optimise the performance of the code when they run it on their local machines. Additionally, she creates a detailed user guide that includes instructions on how to make the most efficient use of her package, including tips on how to optimise the performance of the code when running it on different hardware configurations.
- Whilst it’s difficult to estimate the overall impact of this work, with her help the members of her research group that Celia works with were able to improve throughput when using her package by 6%.
Reducing Wasted Runs
- Celia takes a pass at improving the error handling and input validation in her code to reduce the likelihood of running into errors that lead to repeated runs of the code. She implements a new configuration validation approach. She ways to catch some failure modes early before significant computation has occurred.
- Again it’s difficult to estimate the impact of this work but when these changes were released Celia is contacted by several users confused by the new errors. This suggests the changes are catching at least some errors.
Hardware Usage
She decides to keep using the laptop for as long as its lifespan, instead of replacing it too soon.
Other
Celia also integrates the codecarbon as an optional dependency in her code base so that it can report the carbon emissions when the code is run. This allows her to more easily track the emissions associated with the usage of her package.
Outcomes
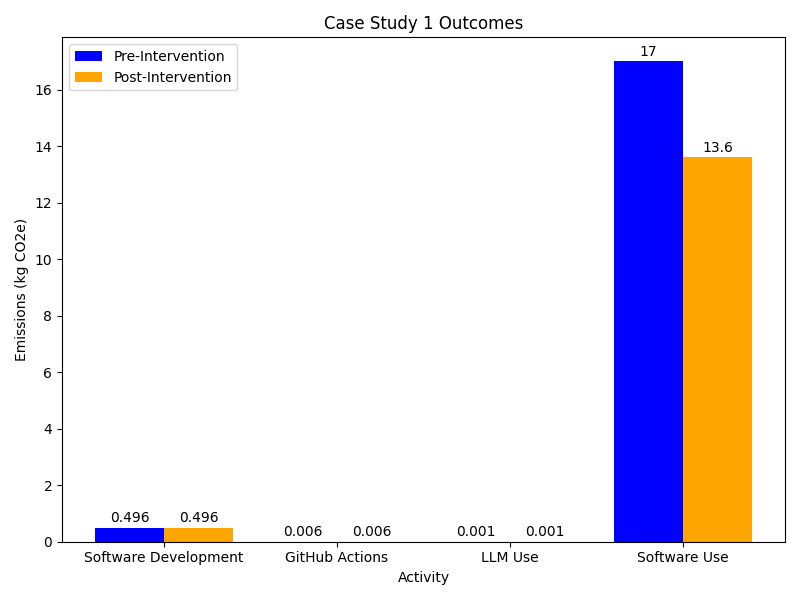
Reviewing the changes she’s implemented Celia estimates a reduction of around 20% in the emissions from usage of her package. That’s a weekly saving of around 3.5 kgCO₂e per week or an annual saving of around 175 kgCO₂e.
- Research software development can have significant environmental impacts.
- Measuring and estimating carbon emissions from research software development is important for identifying areas for improvement.
- GitHub Actions and LLMs should be used judiciously to avoid unnecessary emissions.
- Performance profiling can be a useful tool for identifying areas of code that could be optimised to reduce emissions.
- Providing good user documentation and support can help users to make more efficient use of software, reducing emissions from usage.