1 Model Schematic
We provide schematics for different parts of the model outlined here. These are useful because they clarify how different model objects, including data and parameters, are related to one another.
Figure 2.1 illustrates a complete observational model, and in particular details the model for multipliers \(\alpha_t\). Figure 3.1 presents the basic infection model, and also shows the GLM-style model for reproduction numbers \(R_t\). Finally Figure 4.1 shows treating latent infections as parameters.
All mathematical notation shown in the figures corresponds to that used in the model description article. Each node is outlined in a color corresponding to the type of object considered. These are interpreted as follows.
- Grey: A user provided object or quantity that is assumed to be known.
- Green: A model parameter that is, generally speaking, directly sampled. Occasionally epidemia will sample a transformation of this parameter for efficiency purposes.
- Red: A transformed parameter. This is a quantity that is a deterministic function of other model parameters.
- Orange: A quantity that is either a parameter or transformed parameter, depending on the context.
- Blue: An observation.
2 Observational Model
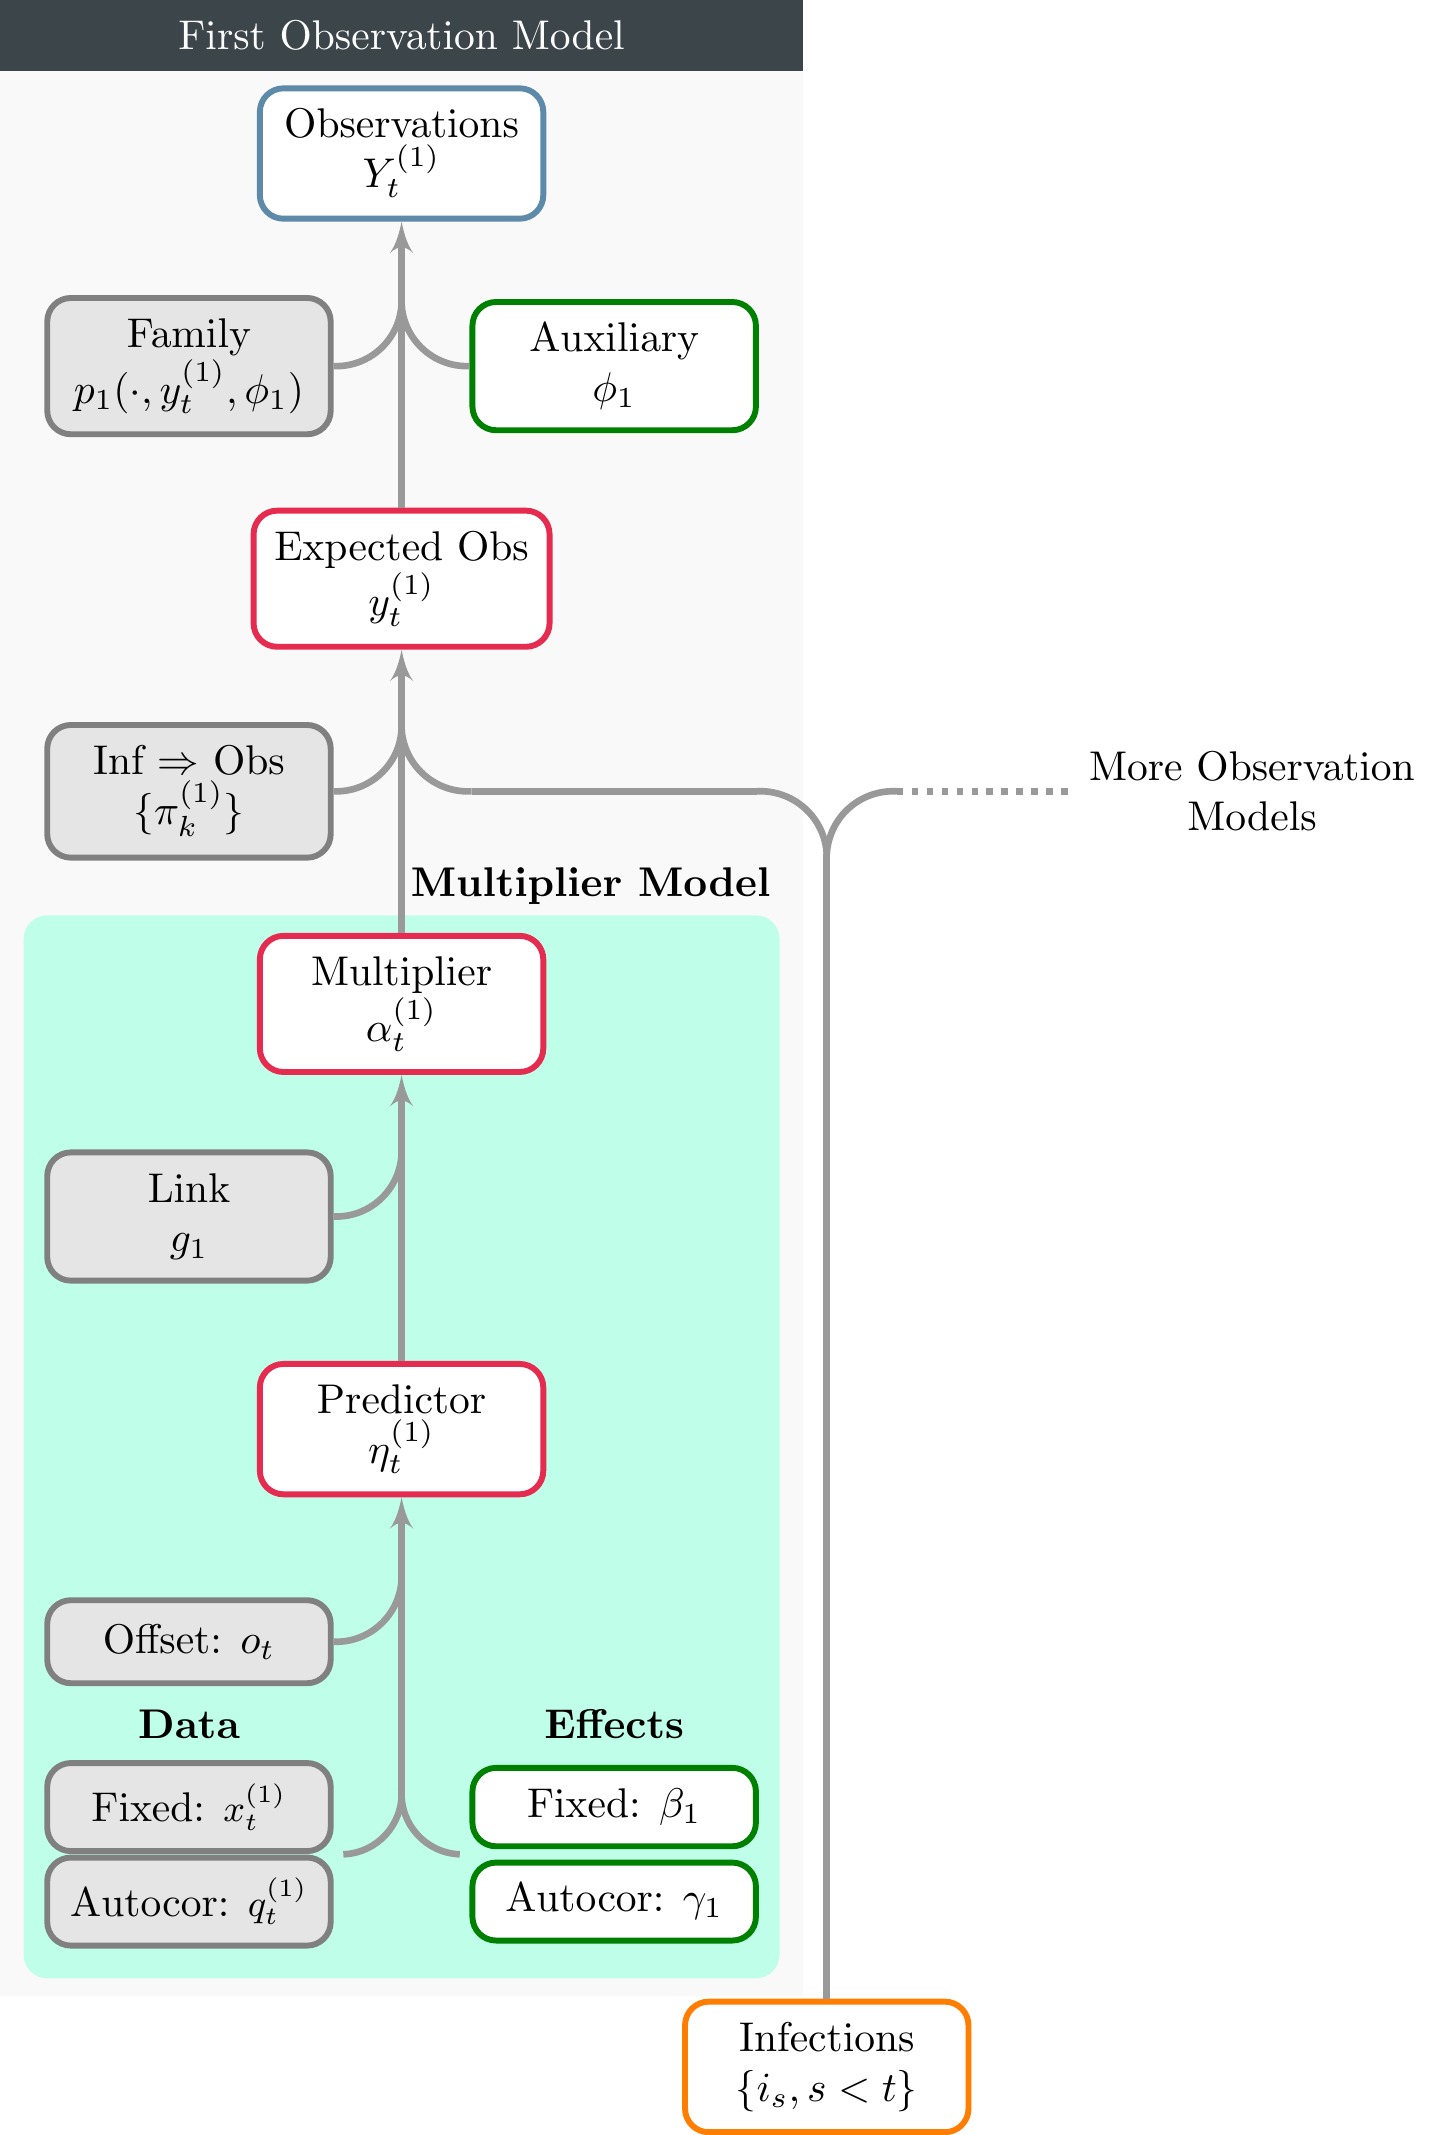
Figure 2.1: A schematic for observational models. Only one observational model is shown here, however the figure makes clear that additional models may be included. The model for the multiplier \(\alpha_t\) is shown in the shaded green region. This is very similar in form to the transmission model shown in Figure 3.1. Infections shown at the bottom may be directly from either the basic infection model, or from an extended model (as described in the model description).
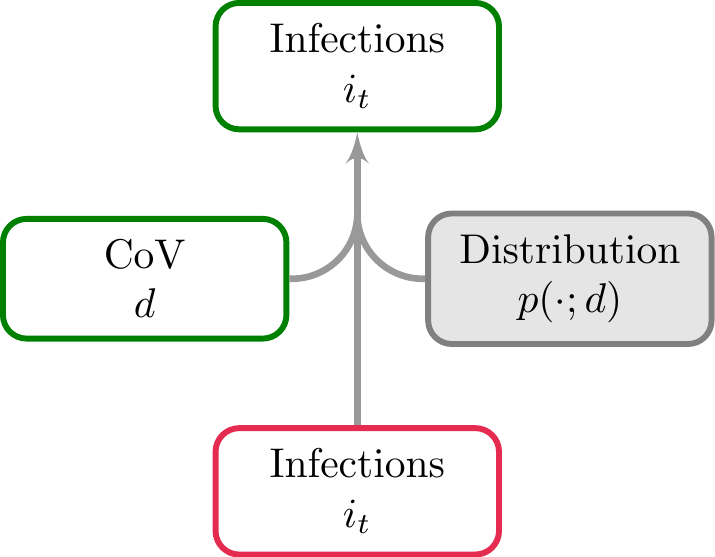
3 Basic Infection Model
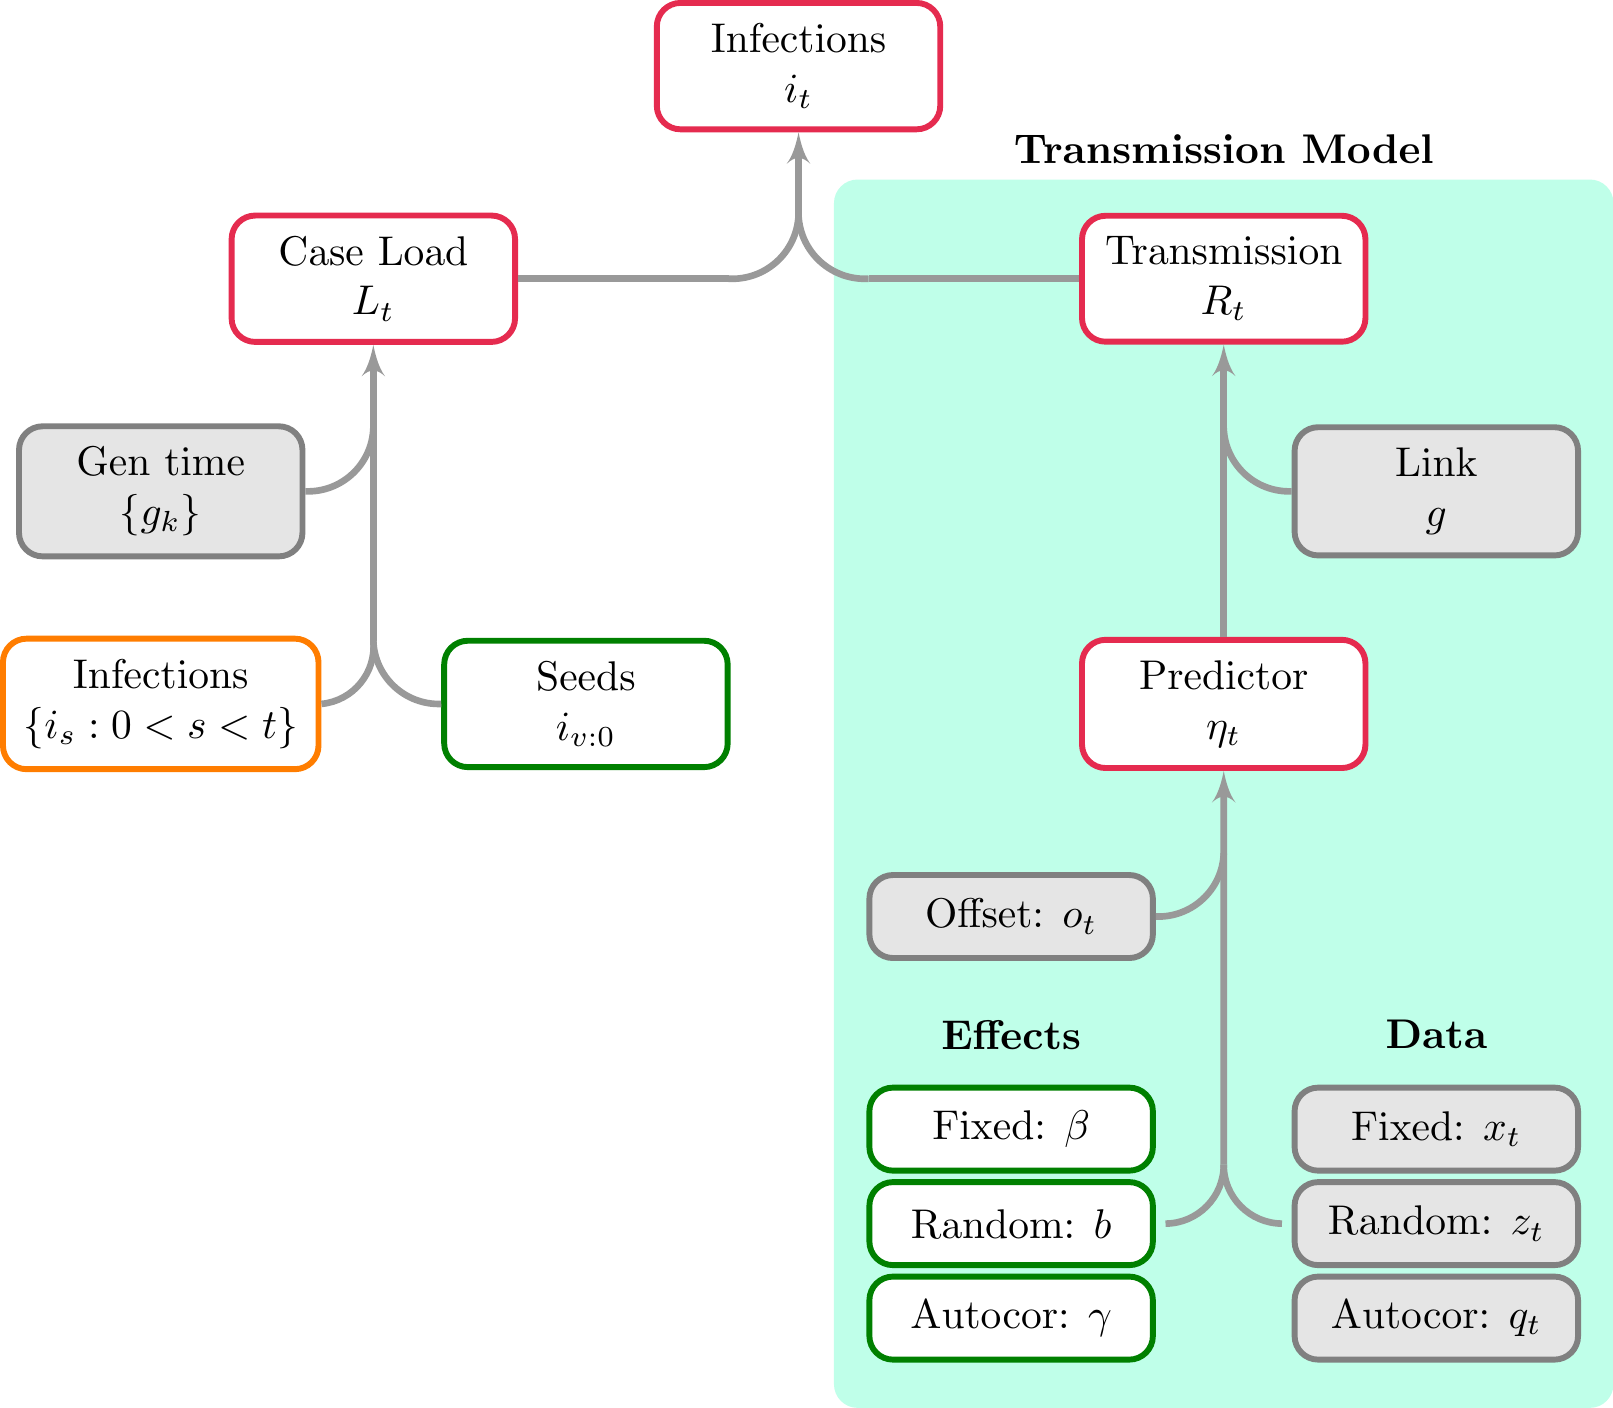
Figure 3.1: A schematic showing both the basic infection model and the transmission model (the green region). Here infections are a transformed parameter, and are recursively linked to previous infections. The model for \(R_t\) is similar to a GLM, however autocorrelation terms can be included. \(\eta_t\) is the predictor for the reproduction number at time \(t\), and is one element of the predictor \(\eta\) introduced in the model description.