All Images
Why sustainable digital research matters
Figure 1

Placeholder image - Challenges of environmental
sustainability
Figure 2

Placeholder image - Mindful computing and what
it means for different people (use Rae’s interpretation of the following
paragraph)
Energy, power and carbon
Figure 1
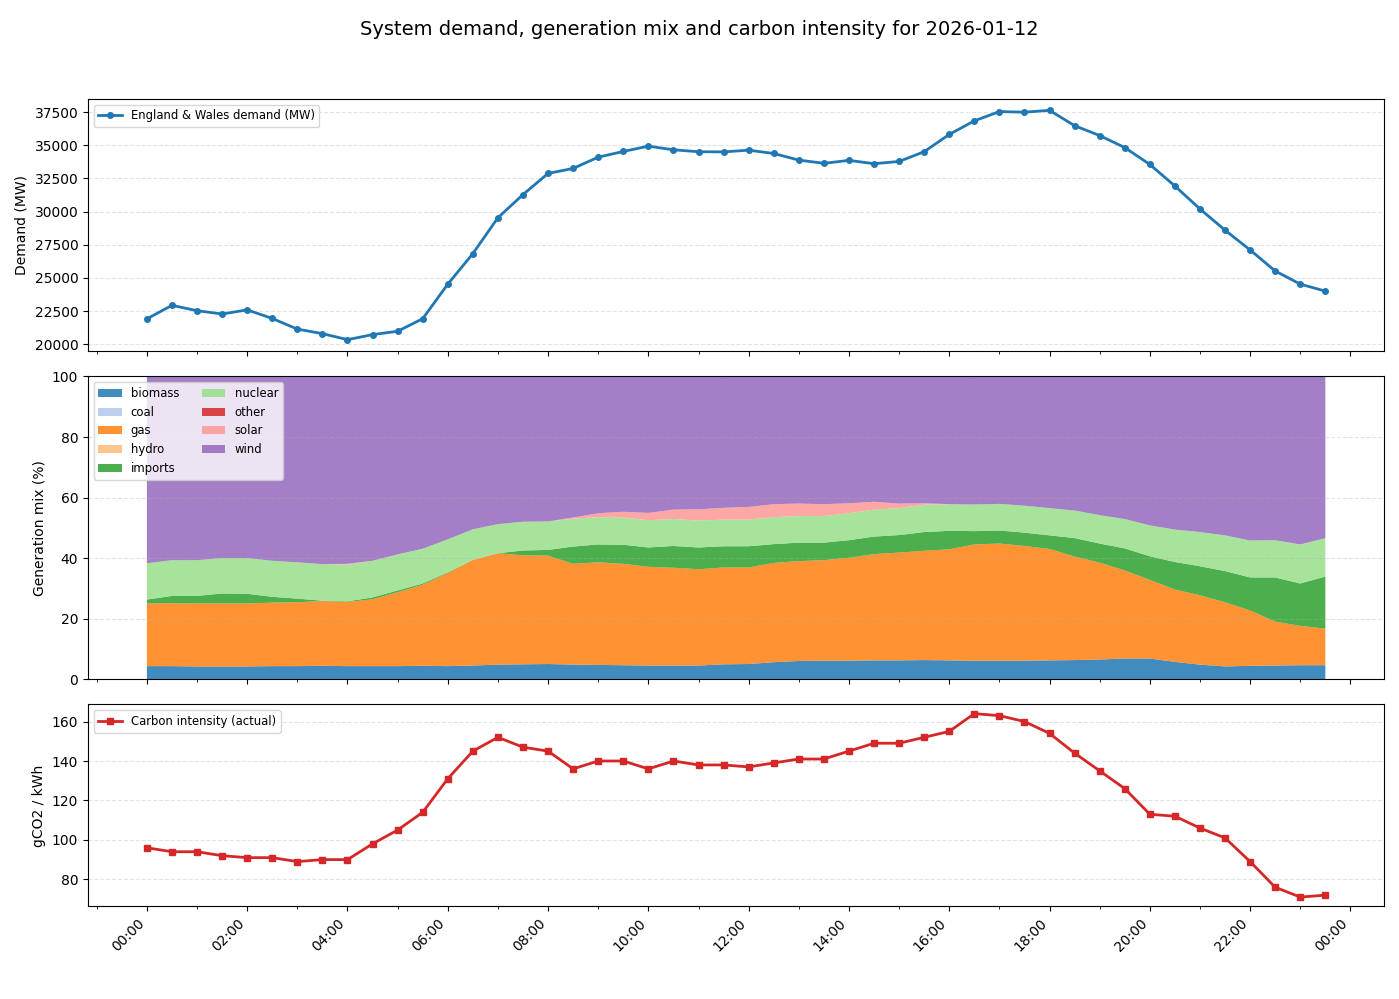
Electricity demand, energy mix and carbon
intensity of the UK power grid as on 12/01/2026
Figure 2
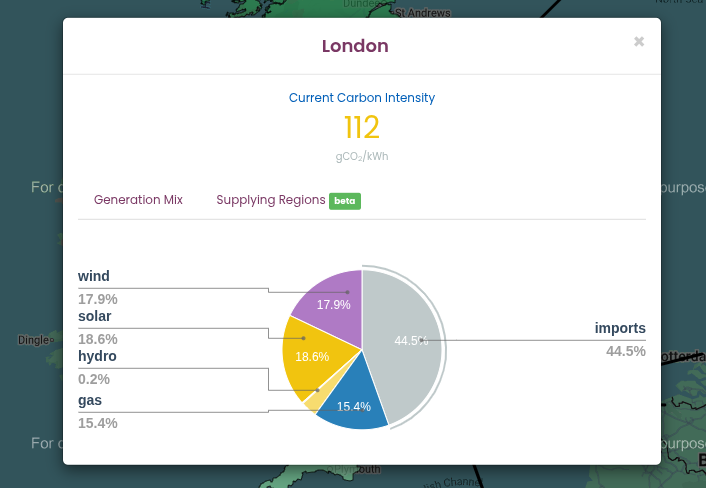
Energy generation mix pie chart on a sunny day
in London obtained from https://carbonintensity.org.uk/
Figure 3
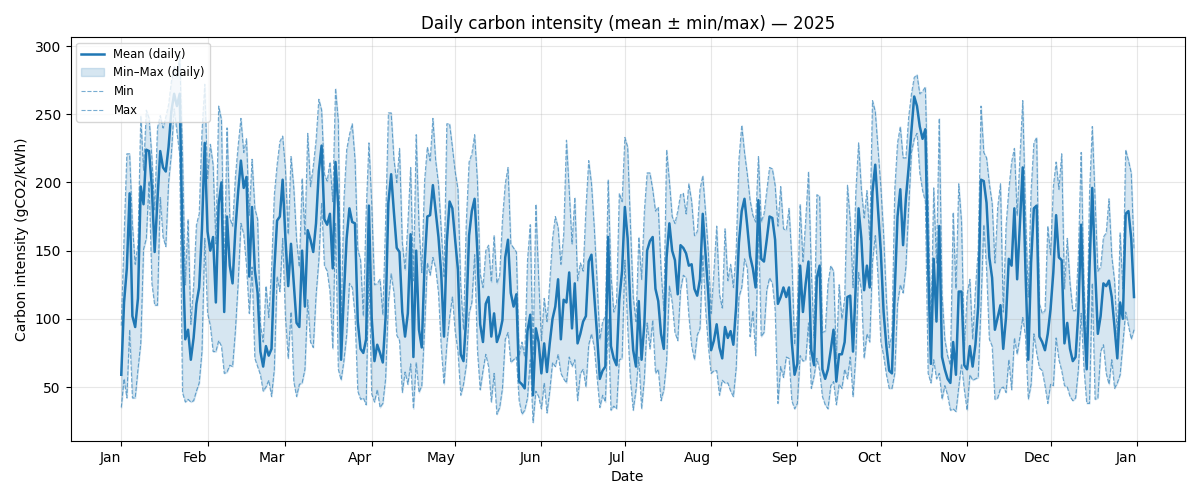
Carbon intensity of the UK power grid during
2025
Figure 4
PLACEHOLDER
Digital research activities with sustainability issues
Figure 1

Placeholder image - What components of digital
infrastructure produce carbon emissions? (Image by Rae)
Figure 2
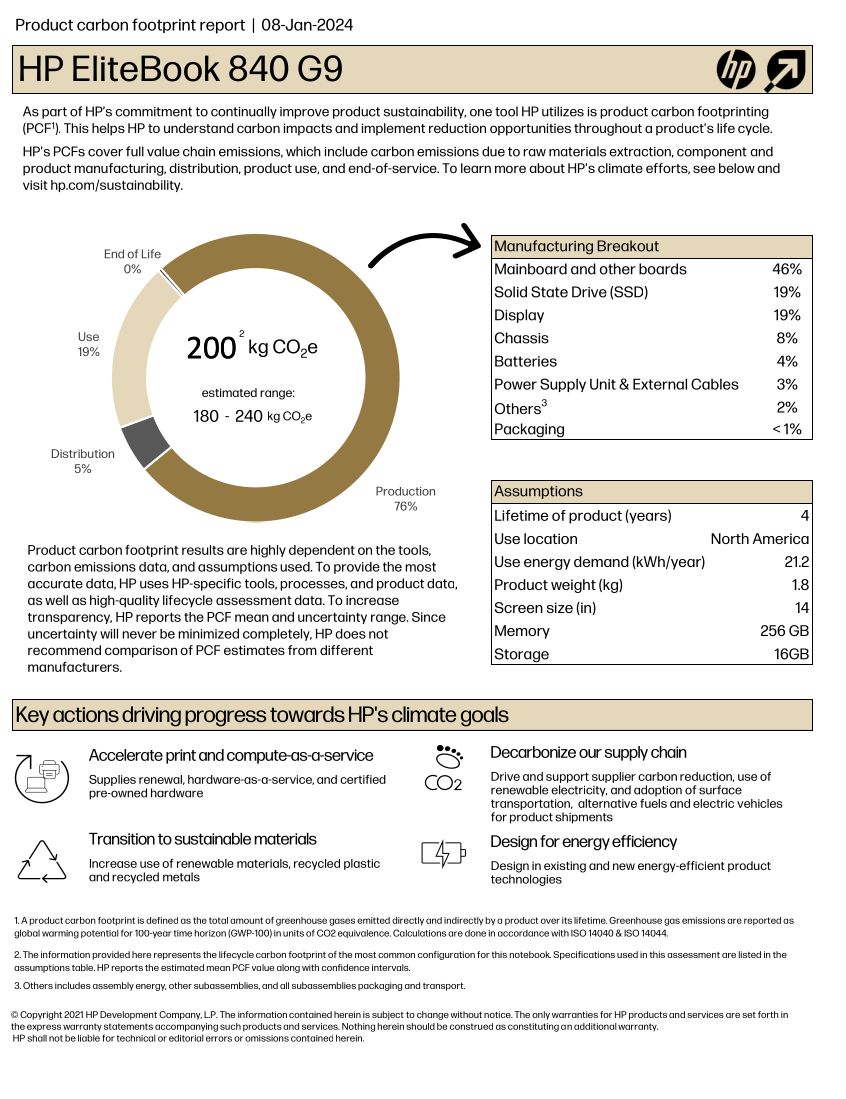
Product Carbon Footprint for HP EliteBook 840
G9
Figure 3
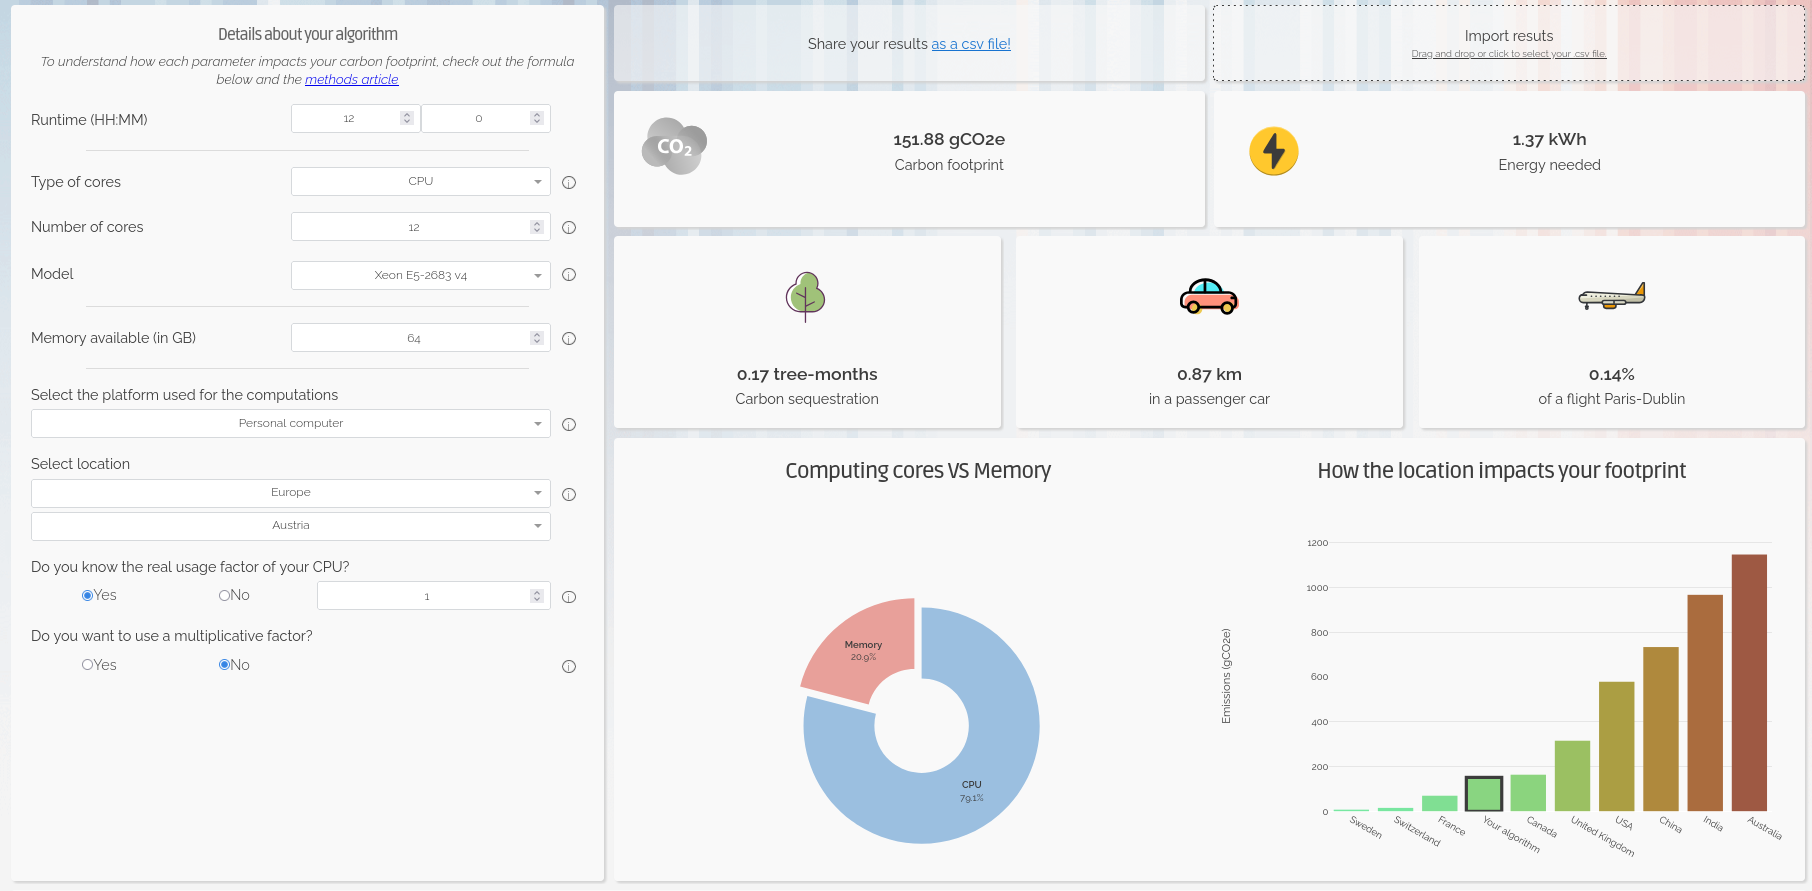
Screenshot of the Green Algorithms
Calculator
Figure 4
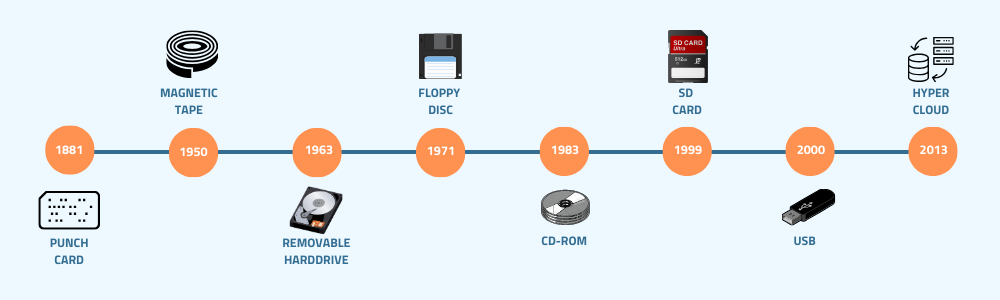
History of digital storage media. Image from the
blog post “Data
storage through history”
Figure 5
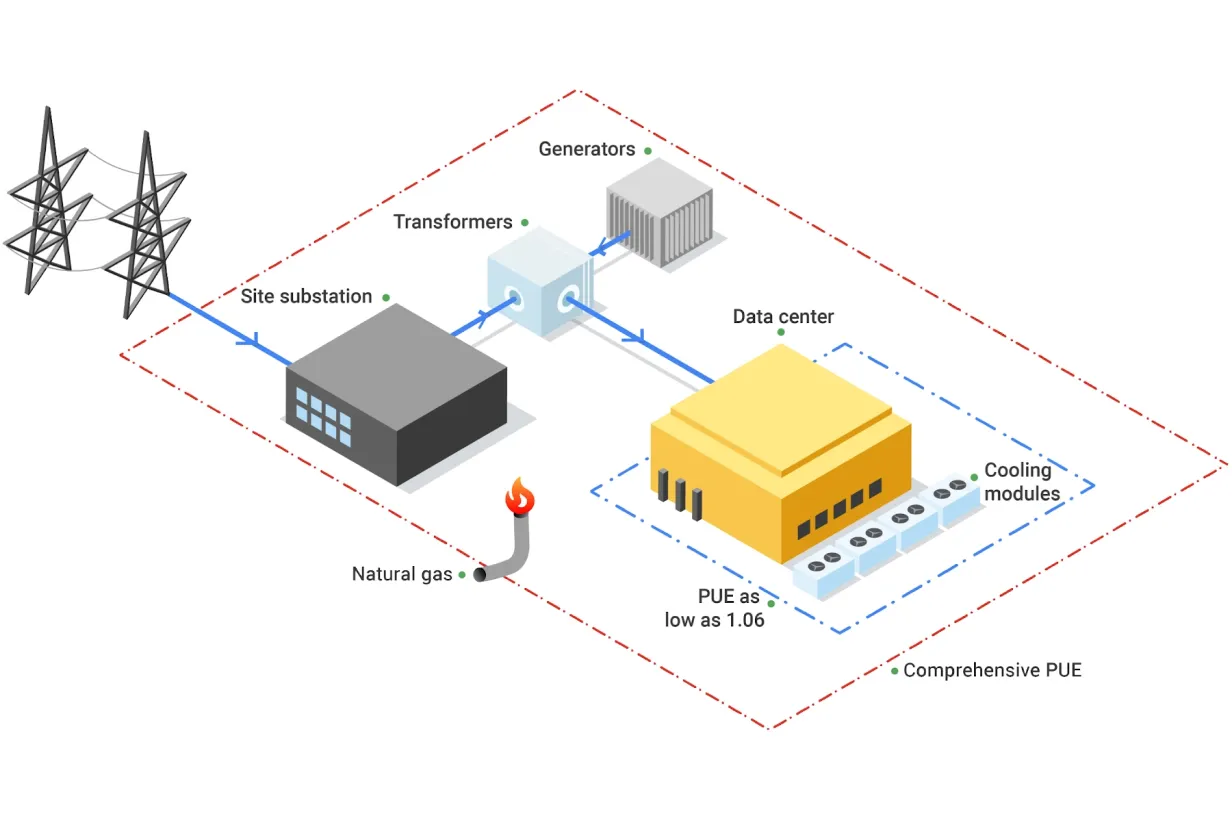
Google Data Center PUE measurement
boundaries
Figure 6
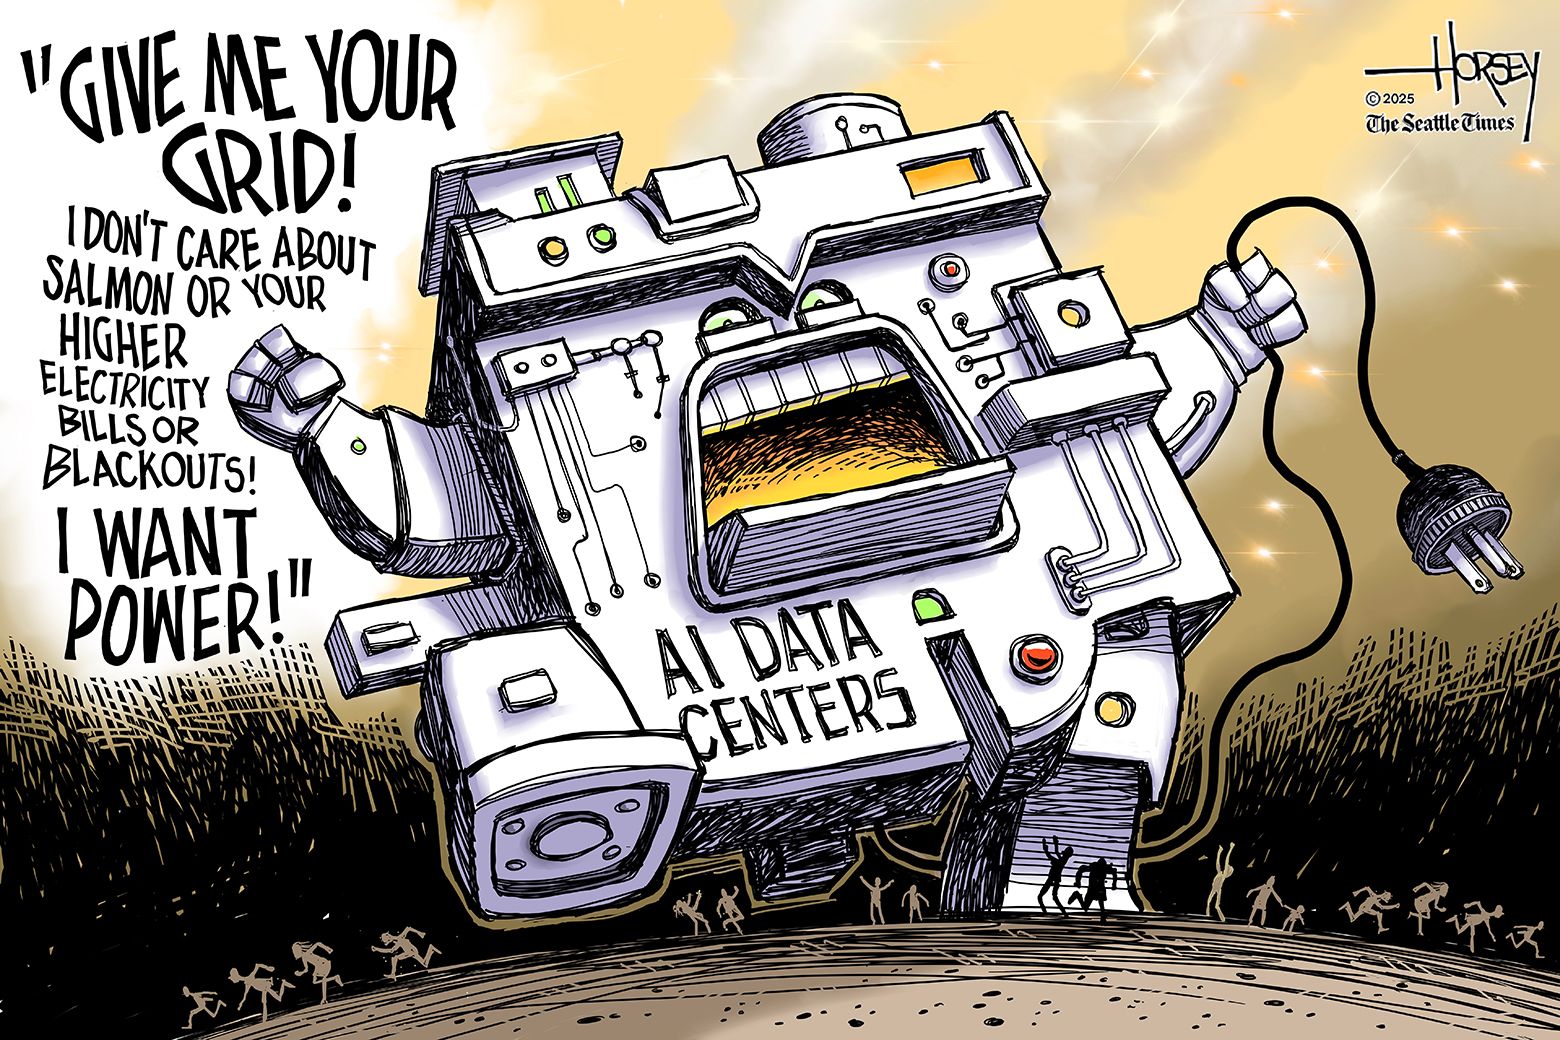
Data centers consume huge amounts of energy and
water, which can be a risk for the environment. Image originally
published at The
Seattle Times.
Introduction to the Case Studies
Case Study 1 - Research Software Engineer
Figure 1
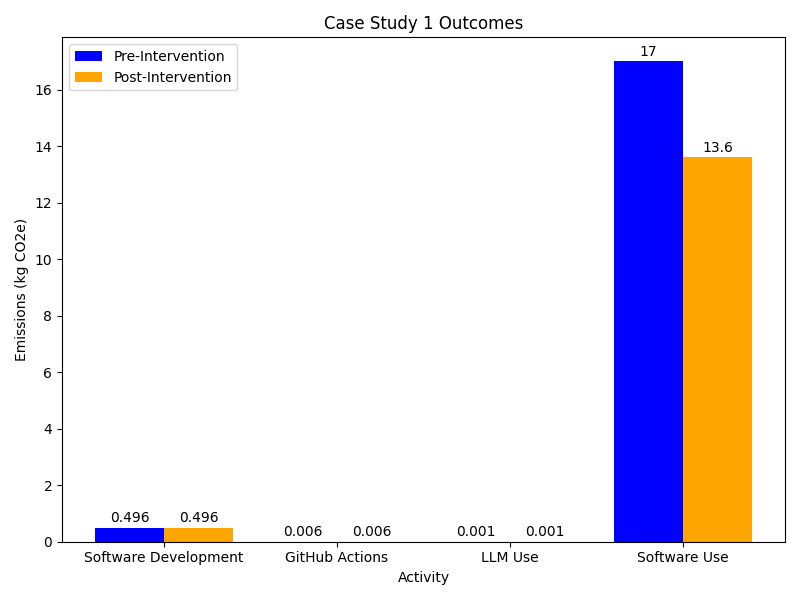
Carbon emissions for different research actions
comparing pre- and post-intervention
Case Study 2 - Lab Scientist doing computational work
Figure 1
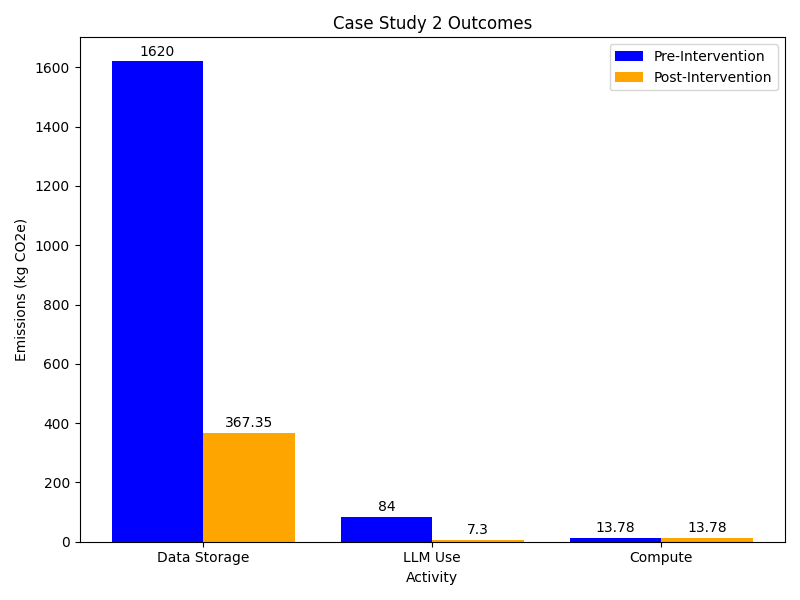
Carbon emissions for different research actions
comparing pre- and post-intervention
Case Study 3 - HPC User
Figure 1
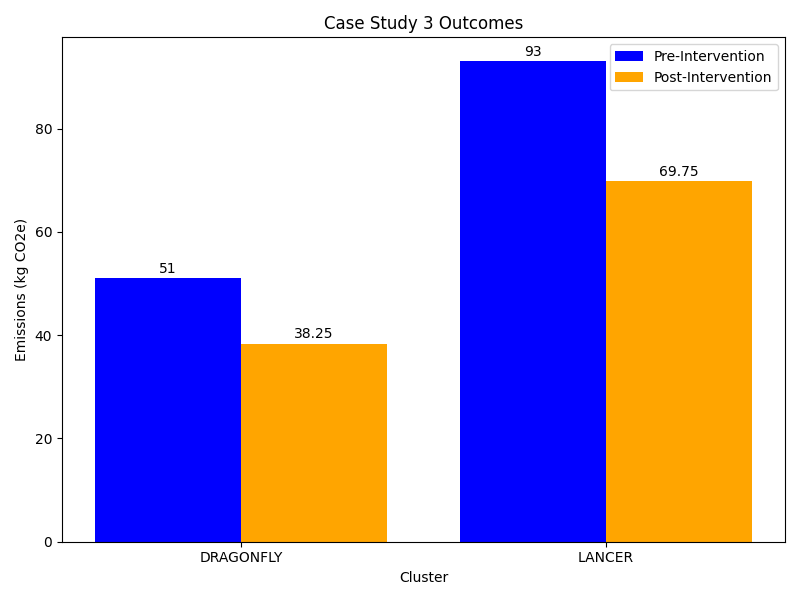
Carbon emissions from each cluter comparing pre-
and post-intervention