
Case Study 3 - HPC User
Last updated on 2026-07-29 | Edit this page
Overview
Questions
- What are the key sources of carbon emissions when using High Performance Computing facilities?
- How can HPC users estimate emissions when clusters provide different levels of carbon monitoring tools?
- What strategies can reduce carbon emissions from HPC workloads without compromising research throughput?
- How do workload optimization, resource selection, and job management affect carbon emissions?
Objectives
- Collect usage data across multiple HPC facilities and estimate associated carbon emissions using available tools and approximation methods.
- Analyze HPC workload patterns to identify wasted computation, optimization opportunities, and hardware efficiency differences.
- Evaluate trade-offs between computational speed and resource efficiency through benchmarking studies.
- Implement emission reduction strategies including code compilation optimization, workload benchmarking, better job validation, and strategic resource allocation.
Introduction

Hugh is working on several different research questions that requires the use of different simulation software. Choice of which software to use is usually driven by existing research data and the capabilities of different codes. Whilst he often makes use of software that has been pre-installed by system administrators, he sometimes has to compile packages himself.
In addition to simulation work, Hugh carries out data analysis and creates visualisations.
Hugh has access to 2 different HPC facilities he can make use of:
- a general purpose institutional cluster offering a mix of CPUs.
- a cluster providing targeted support for the atomistic simulation community.
Both facilities are heavily subscribed and Hugh tries to maximise his throughput at all times. Workloads on these clusters are submitted to a queue and will start running at an unknown time. Almost all of his workloads run for at least 48 hours.
Collecting Information
Data exploration (20 minutes)
Hugh wants to estimate the emissions associated with his HPC usage. What methodologies could he use? What data would be useful to collect?
Operational Emissions
- As Hugh does not have direct access to the clusters, he’s likely restricted from making direct measurements. It may be possible to incorporate codecarbon into his workflows but this may be challenging (e.g. the RAPL interface may not be accessible to users, multi-node jobs or shared-node jobs would need to be accounted for).
- An estimation methodology such as the Green Algorithms Calculator should be fairly readily usable. In this case Hugh should collect as much detail as he can about his resource usage on the system and the hardware.
- Another method for estimation would be if Hugh is able to get power draw data for the cluster. This information may be available from the system administrators, most likely in an aggregated form. Combined with some data or assumptions about system utilisation and carbon intensity an estimate could be derived based on his resource usage.
- Some HPC system may also provide tooling that reports job power draw or even carbon emission estimates.
- A key value to include is the Power Utilisation Efficiency (PUE) of the system. In most cases this is not published but may be available on request.
Embodied Emissions
- For a known set of hardware Hugh would likely be able to look up PCF data sheets to get estimates of the embodied emissions.
- As an end-user Hugh is dependent on information provided by the service or which he can gather himself. Most HPC services publish information regarding the type and amount of CPUs, GPUs, memory, etc. It is rarer for services to provide a full inventory including the exact models of servers, networking infrastructure, storage devices, etc., that would be required to calculate the embodied emissions of the service as a whole.
- Some services may publish an embodied carbon analysis.
Analysis
Estimating Emissions (20 minutes)
Hugh does some investigation and finds the below information:
General Background
DRAGONFLY is a cluster based in London. It doesn’t publish any sustainability information. The documentation pages provide some lists of the available hardware but these are fairly high level and don’t include specific CPU or server models.
LANCER is a cluster based in Wales. Its documentation has some dedicated information on sustainability including a GHG analysis of the cluster. This includes an embodied emissions analysis as well as total power usage. Most usefully Hugh finds that the cluster provides a tool for users to estimate the carbon emissions of their workloads. This tool has been tested and calibrated for the cluster so should be fairly accurate.
HPC workloads
Hugh is confident that his simulation workflows form the vast majority of his HPC usage so he decides to focus on these. He tracks the total CPU-hours spent on different clusters and the different simulation codes used on each one. He also gets the total estimated emissions for LANCER using the provided cluster tooling.
| Cluster | Simulation Code | Total CPU-hours | Notes | Emissions (kgCO₂e) |
|---|---|---|---|---|
| DRAGONFLY | GROMINZ | 45,000 | Self-compiled | |
| ORANGE | 30,000 | |||
| LUMMPS | 20,000 | |||
| LANCER | GROMINZ | 60,000 | Self-compiled | 32 |
| ORANGE | 40,000 | 21 | ||
| LUMMPS | 75,000 | 40 |
Whilst collecting the above data Hugh also notes that around 15,000 CPU-hours were wasted on from some workloads on LANCER that he hadn’t setup properly and which had to be repeated.
By scaling the emissions estimates for LANCER by the relative resource usages estimate the emissions for each code on DRAGONFLY. Use the result to estimate Hugh’s annual emissions. Also estimate the emissions from the 15,000 wasted CPU-hours. What are the limitations of the estimates produced using this method and how could it be improved?
Embodied emissions
Whilst the embodied emissions for the clusters are relevant to calculating the carbon impact of his work, Hugh notes that these are a sunk cost that he is unable to impact at this point. LANCER provides some data but DRAGONFLY doesn’t provide nearly enough information to make much headway. Hugh emails the admins of DRAGONFLY but they’re unable to provide him with more information. Based on this Hugh decides not to consider embodied emissions in his analysis.
Taking GROMINZ as an example:
\[ Emissions_{DRAGONFLY} = \frac{Resources_{DRAGONFLY}}{Resources_{LANCER}} * Emissions_{LANCER} \\ Emissions_{DRAGONFLY} = \frac{45000 CPUhours}{60000 CPUhours} * 32 kgCO_2e \\ Emissions_{DRAGONFLY} = 24 kgCO_2e \]
Applying this to the other simulation codes gives:
| Cluster | Simulation Code | Total CPU-hours | Notes | Emissions (kgCO₂e) |
|---|---|---|---|---|
| DRAGONFLY | GROMINZ | 45,000 | Self-compiled | 24 |
| ORANGE | 30,000 | 16 | ||
| LUMMPS | 20,000 | 11 | ||
| LANCER | GROMINZ | 60,000 | Self-compiled | 32 |
| ORANGE | 40,000 | 21 | ||
| LUMMPS | 75,000 | 40 |
This gives a total 144 kgCO₂e from the two week period.
To better understand what this figure means Hugh, takes his total emissions figure from the two weeks and compares it with other emissions sources. He finds that 144 kgCO₂e is approximately equivalent to driving for around 500 miles in a petrol fueled car1.
Scaling the number for two weeks up to a full year, Hugh gets a total of 3.5 TCO₂e. He notes that this is close to the UK per-capita emissions for energy generation. This means the electricity demands of his work is nearly equivalent to those of whole second person.
Deriving an estimate for the wasted emissions is fairly simple is it makes a quarter of his use of GROMINZ on LANCER - a total of 8 kgCO₂e.
The limitations of this methodology come from assumping that usage of a given set of CPU-hours on each system leads to the same amount of carbon emissions. In practice factors such as the PUE, carbon intensity, CPU model, etc. mean this is unlikely to be the case. The estimate could be improved if Hugh can get information like the PUE or relevant carbon intensity values for both clusters.
Taking Action
Measures to Reduce Emissions (20 minutes)
Hugh takes his emissions estimates and comes up with some steps to help to reduce emissions.
In your groups discussion any other measures that Hugh could implement and what impact they might have. What steps could Hugh take to get better data to refine the emissions estimates he’s made so far?
Hugh Takes Action
Based on the data gathered above Hugh observes:
- He spends the most CPU-hours on LANCER.
- He spends the most CPU-hours using GROMINZ.
This suggests Hugh will get the most impact by focussing his efforts on these areas. Hugh wants to be able to measure the impact of any changes he makes which can be best done using the emissions tooling on LANCER. He’s also confident that most changes he makes on LANCER will be transferable to DRAGONFLY even if he can’t measure the impact so directly there.
In order to minimise his emissions Hugh realises he can both improve the efficiency of the simulations he performs and try to reduce the overall amount of simulation.
Reducing Simulation
The 15,000 wasted CPU-hours of simulation are an obvious initial target. Hugh reviews the jobs that went wrong and identifies the root causes. He then adjusts his workflows to prevent them happening again. To help in the future, he agrees with a member of his research group that they will double check each others simulation inputs before starting significant new simulation projects. With these measures Hugh estimates that he may be able to reduce his wasted CPU-hours by half.
Hugh’s work requires running simulations for many individual timesteps but it’s often not obvious in advance how many timesteps are required. Reviewing some of his recent projects Hugh concludes that by monitoring his workloads more closely he can terminate some of them earlier. Hugh estimates this could reduce the CPU-hours used per project by 10%.
Optimising Workloads
Hugh notes that GROMINZ is less commonly used in his field and so he has had to compile it himself on both clusters. Hugh doesn’t have a lot of experience doing this and had to piece together how to do it with some online searching and notes from a old colleague. Hugh reaches out to the authors of the code who are able to give him some general advice but can’t offer tailored help. Hugh also gets in touch with the local Research Software Engineering team at his institute who are more familiar with the clusters and are able to provide a small amount of effort to help. Together they identify some tweaks to the compilation and manage to get a 5% speed boost.
To better understand the differences between the codes and clusters he uses Hugh carries out some performance benchmarking. He runs simulations with all of his simulation codes across both clusters. Hugh carefully designs these simulations to be short, so as to not generate too many emissions, but representative of typical workloads. A key finding he identifies is that GROMINZ runs 15% faster on LANCER when using the same number of CPU cores. Meanwhile, ORANGE and LUMMPS don’t show much difference between the two clusters. Hugh realises he can work more efficiently by shifting as much of his work using GROMINZ to LANCER as possible.
Most of Hugh’s simulations require him to run jobs in parallel, using many CPU cores and cluster nodes at the same time. Hugh is familiar with the fact that as his jobs use increasing amount of resources there is a trade-off in computational efficiency. With some of his current projects Hugh realises he has not put much thought into choosing the resources used. Taking one of his recent projects Hugh carries out some benchmarking by running the same simulation using different sets of computational resources. He identifies that for that set of simulations he could have reduced his use of computational resources by 20% whilst only losing 10% speed. Hugh resolves to carry out this sort of benchmarking for all new projects he starts to identify a good trade-off between speed and efficiency.
Outcomes
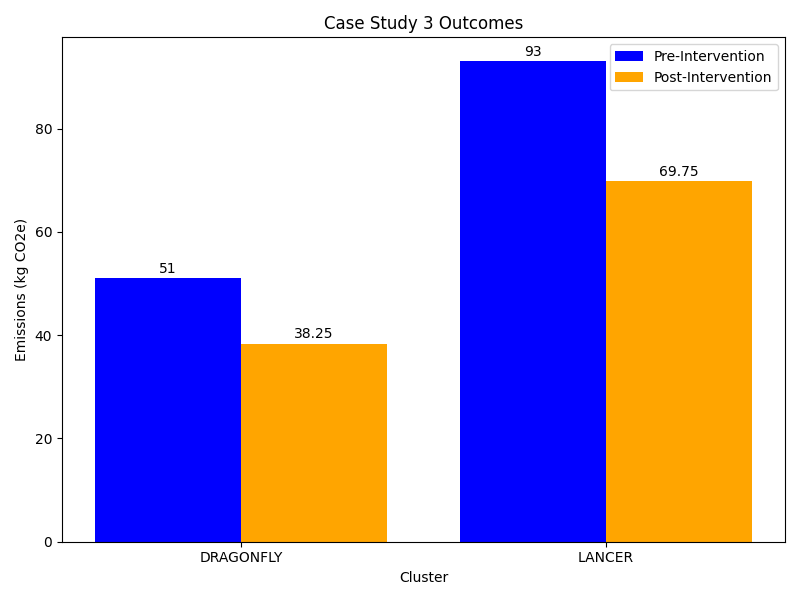
Putting all of the above steps together Hugh estimates that he can reduce his overall use of CPU-hours by 25% across both clusters. This would result in a saving of ~36 kgCO2 from his two week data collection period. Expanding this over a full year gives a reduction of nearly 936 kgCO2. Hugh also continues to collect data on his HPC workloads so that he can assess the impact of the changes he’s made in the future.
Hugh shares his findings with his colleagues in their regular group meeting. Several of his colleagues use the same clusters and simulation codes as him so they are easily able to make use of Hugh’s work.
Hugh also contacts the team maintaining DRAGONFLY highlighting the utility of tools to measure carbon intensity data. The team promises to explore how they can add some more functionality to DRAGONFLY.
References
- Calculated from an emissions rate of 0.27849 kgCO₂e/mile. This is emissions rate reported for an average car in 2025 by the UK Government Conversion Factors for greenhouse gases dataset.
- Tracking actual resource usage across HPC facilities is essential before attempting to measure or reduce associated emissions.
- Wasted computation from failed or misconfigured jobs is a significant and avoidable source of emissions; validating job inputs before submission reduces this waste.
- Different HPC clusters vary in carbon efficiency; benchmarking workloads across available facilities helps identify where to direct them for lowest impact.
- Benchmarking parallel job resource allocation can reveal configurations that reduce energy use with only a modest speed penalty.
- Sharing findings on emissions and efficiency with colleagues and facility operators multiplies the impact of individual actions across a research community.