Introduction
To understand the lessons in this exemplar, I'll first describe our lab's workflow and how we created problems for ourselves.
Setting the scene
Optical Tracking
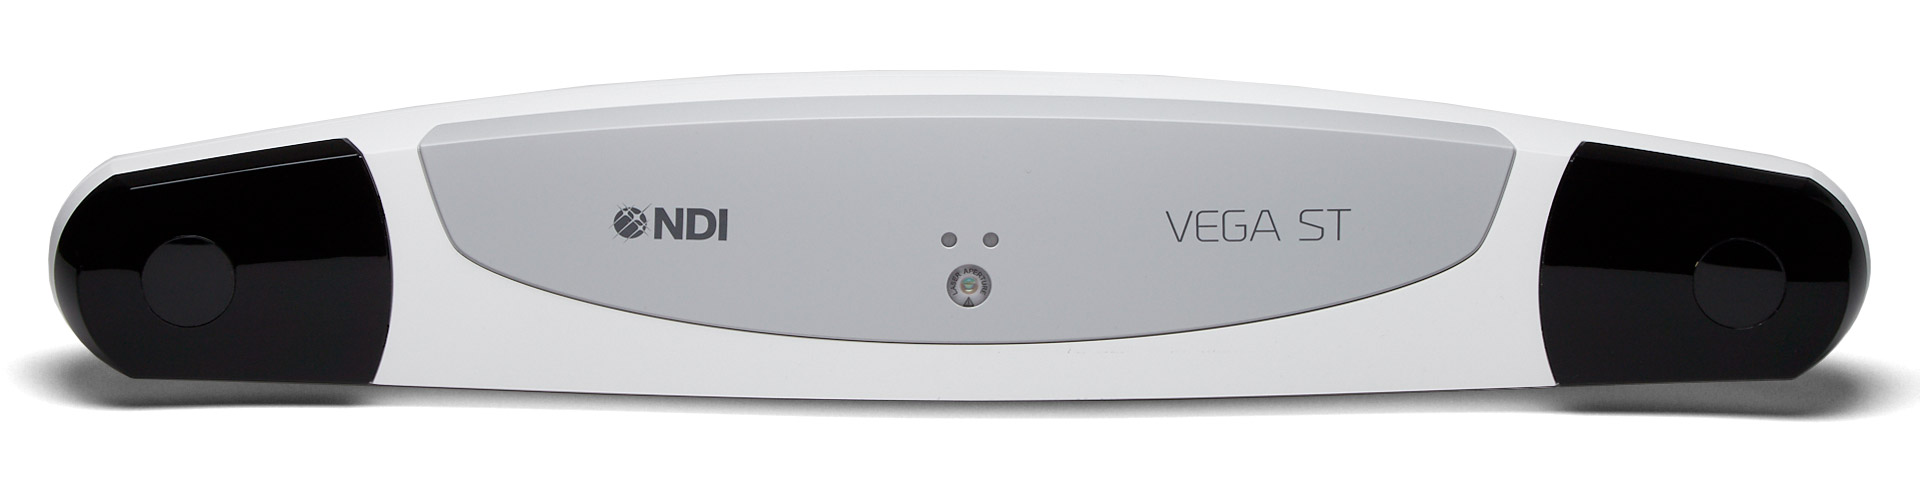 In our lab, we use optical tracking to capture the movement of body parts.
Some systems have an active camera, sending infrared that gets reflected by markers set on the body.
In other systems, the markers emit the light which the camera captures.
We happen to use both, and in both cases the data output from the camera is saved to
In our lab, we use optical tracking to capture the movement of body parts.
Some systems have an active camera, sending infrared that gets reflected by markers set on the body.
In other systems, the markers emit the light which the camera captures.
We happen to use both, and in both cases the data output from the camera is saved to .csv file which, abridged, looks something like this:
Tools   Port 0x01   Femur tracker-Y Frame       Time [sec]          State   Q0      Qx      Qy      Qz    Tx      Ty       Tz         Error
3       Port 0x01   Femur tracker-Y 1391437402  1727257823.36817    OK      -0.18   -0.58   0.75   -0.28  57.82   -87.18   -2688.41   0.2021692
3       Port 0x01   Femur tracker-Y 1391437405  1727257823.41817    OK      -0.18   -0.58   0.75   -0.28  57.72   -87.24   -2688.37   0.217724
Frame   Femur q0    Femur qx    Femur qy    Femur qz    Femur x     Femur y     Femur z     Femur Error
1       -0.18       -0.58       0.75        -0.28       57.82       -87.18      -2688.41    0.08
2       -0.18       -0.58       0.75        -0.28       57.72       -87.24      -2688.37    0.08
While the formatting of data from each camera is slightly different, they are processed to generate exactly the same outputs: joint coordinate systems.
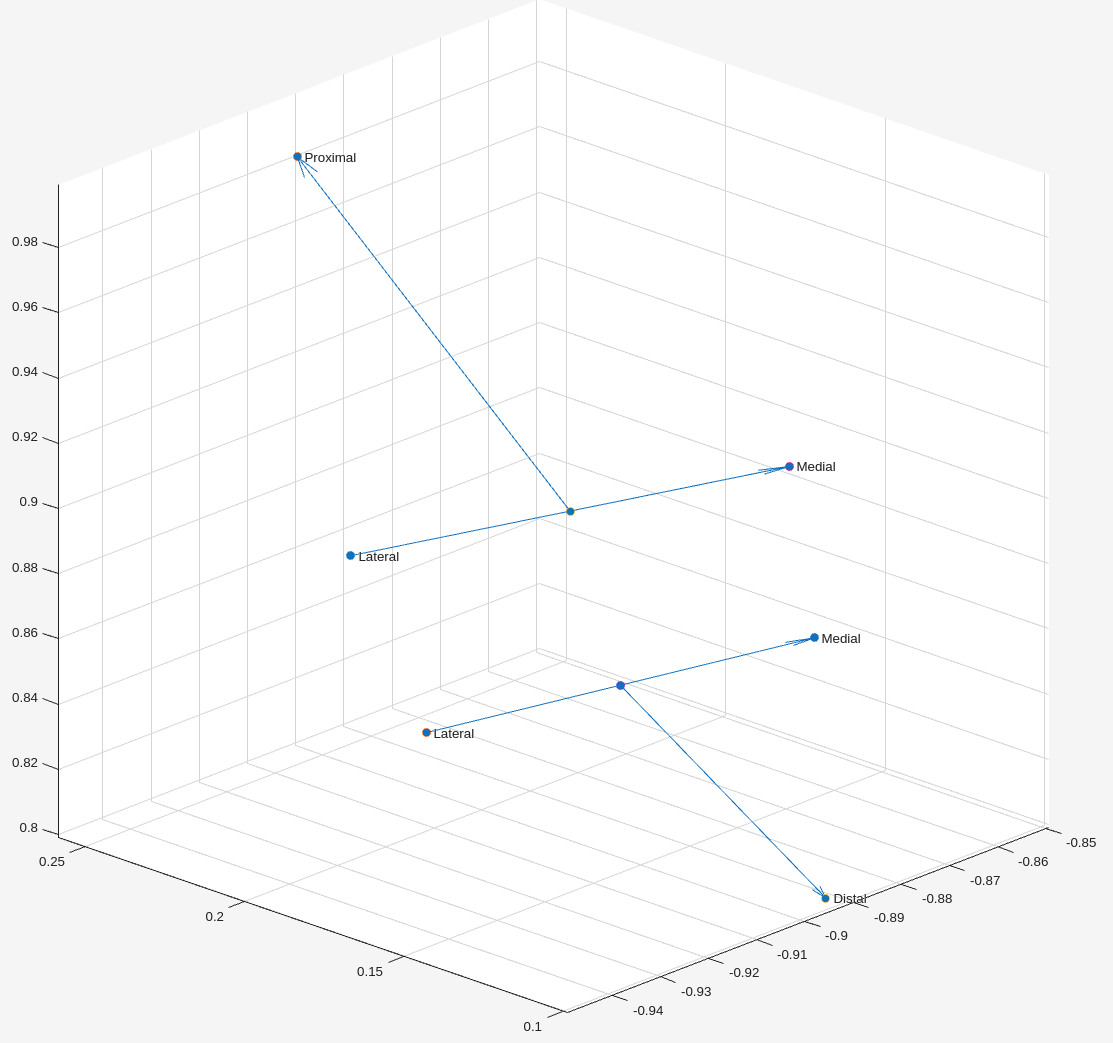 We look at the relative motion between these coordinate systems to calculate how joints move (kinematics).
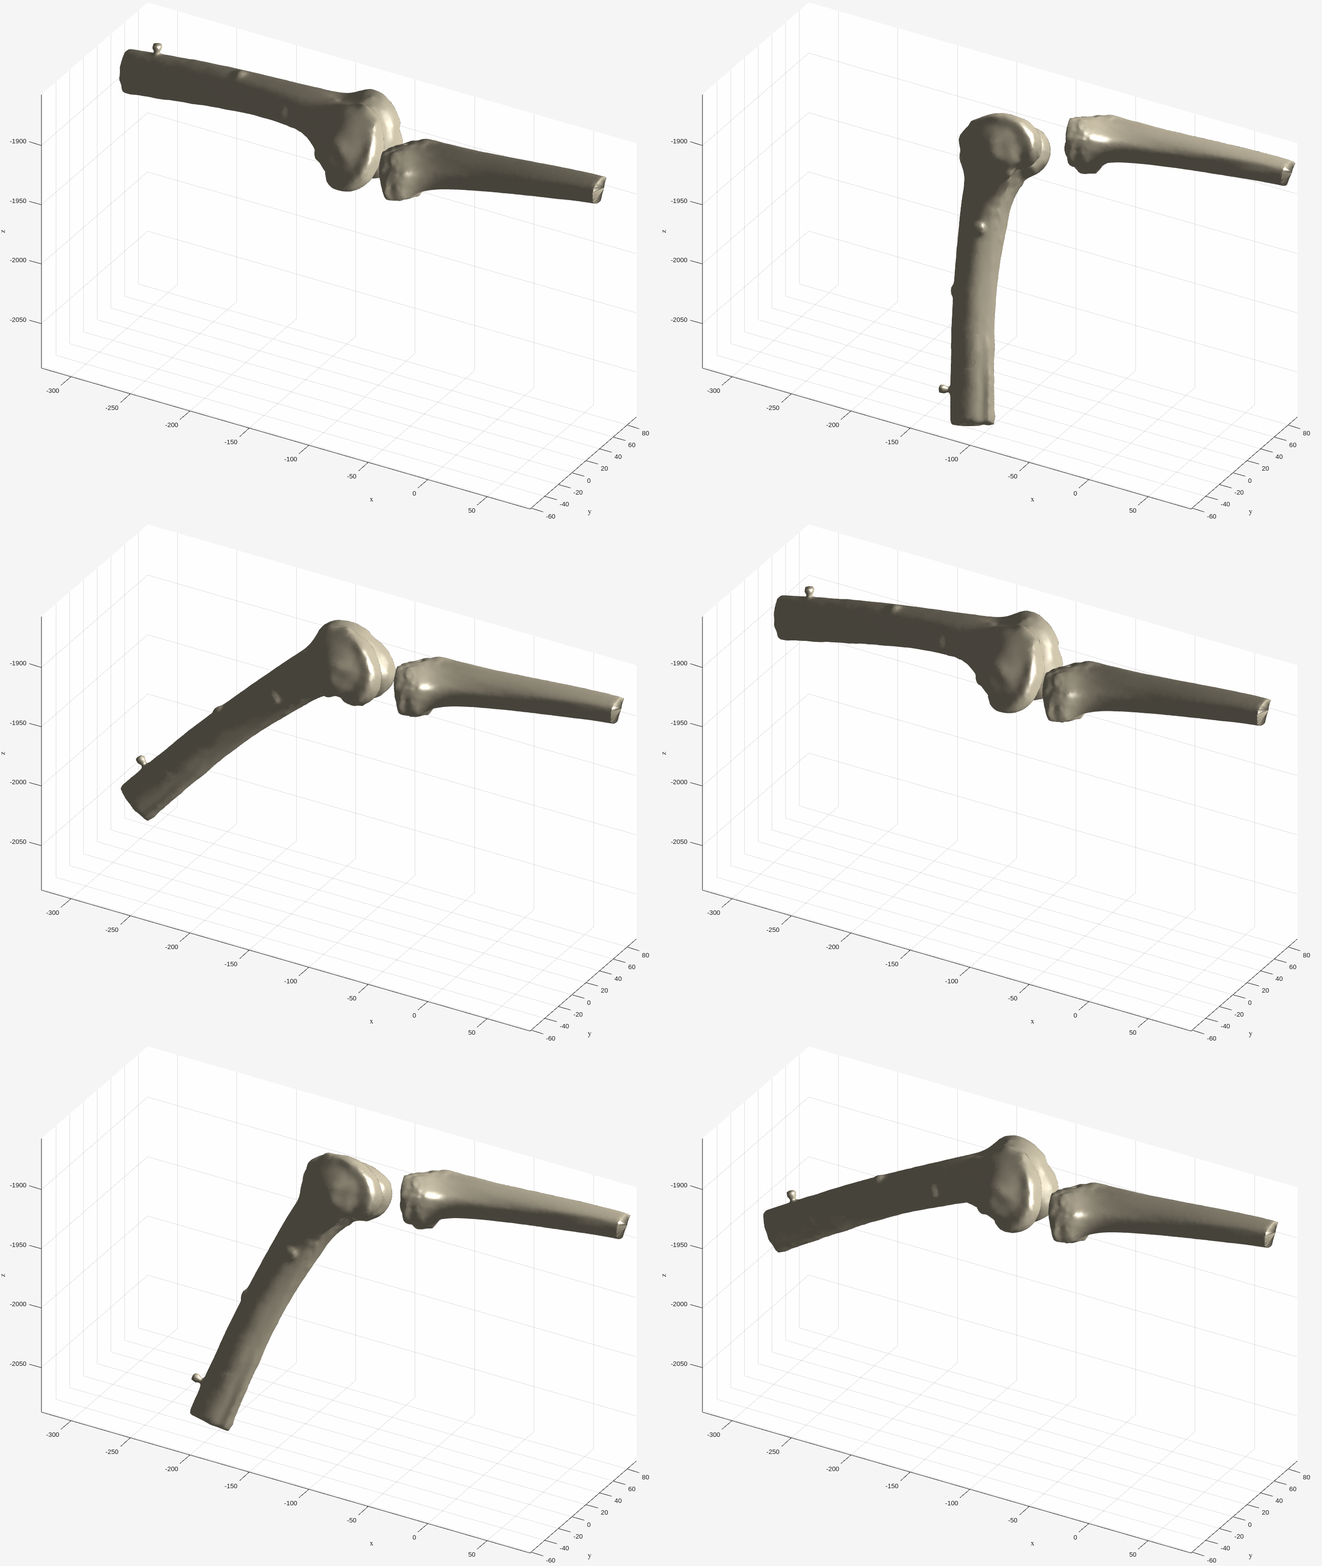
We can also apply these coordinate systems to bone models to create animations of what happened during the experiment.
Occasionally orienting models incorrectly leads to some questionable results:
The problem is that instead of creating a common camera representation, our solution was the worst possible: Create two versions of our codebase -- one for each camera.
6-DOF Robot
Another piece of equipment we use for the same purpose is a 6-degree-of-freedom robot.
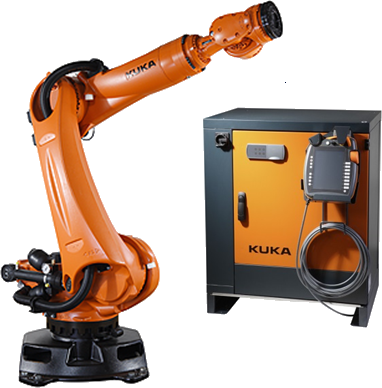
The robot's software uses similar camera data, but the processing is handled directly by them. The only thing left for us to do is create the outputs.
Creating outputs
After the data are processed for either the cameras or the robot, we need to run statistical tests, create plots, etc. Traditionally, we would process the data and leave individual users to decide which tests to run and how to best plot their data. Despite wanting the same outputs, we would post-process it slightly differently and end up with data in different formats, which meant reusing code required a lot of effort.
Workflow
In summary, our workflow looks something like this
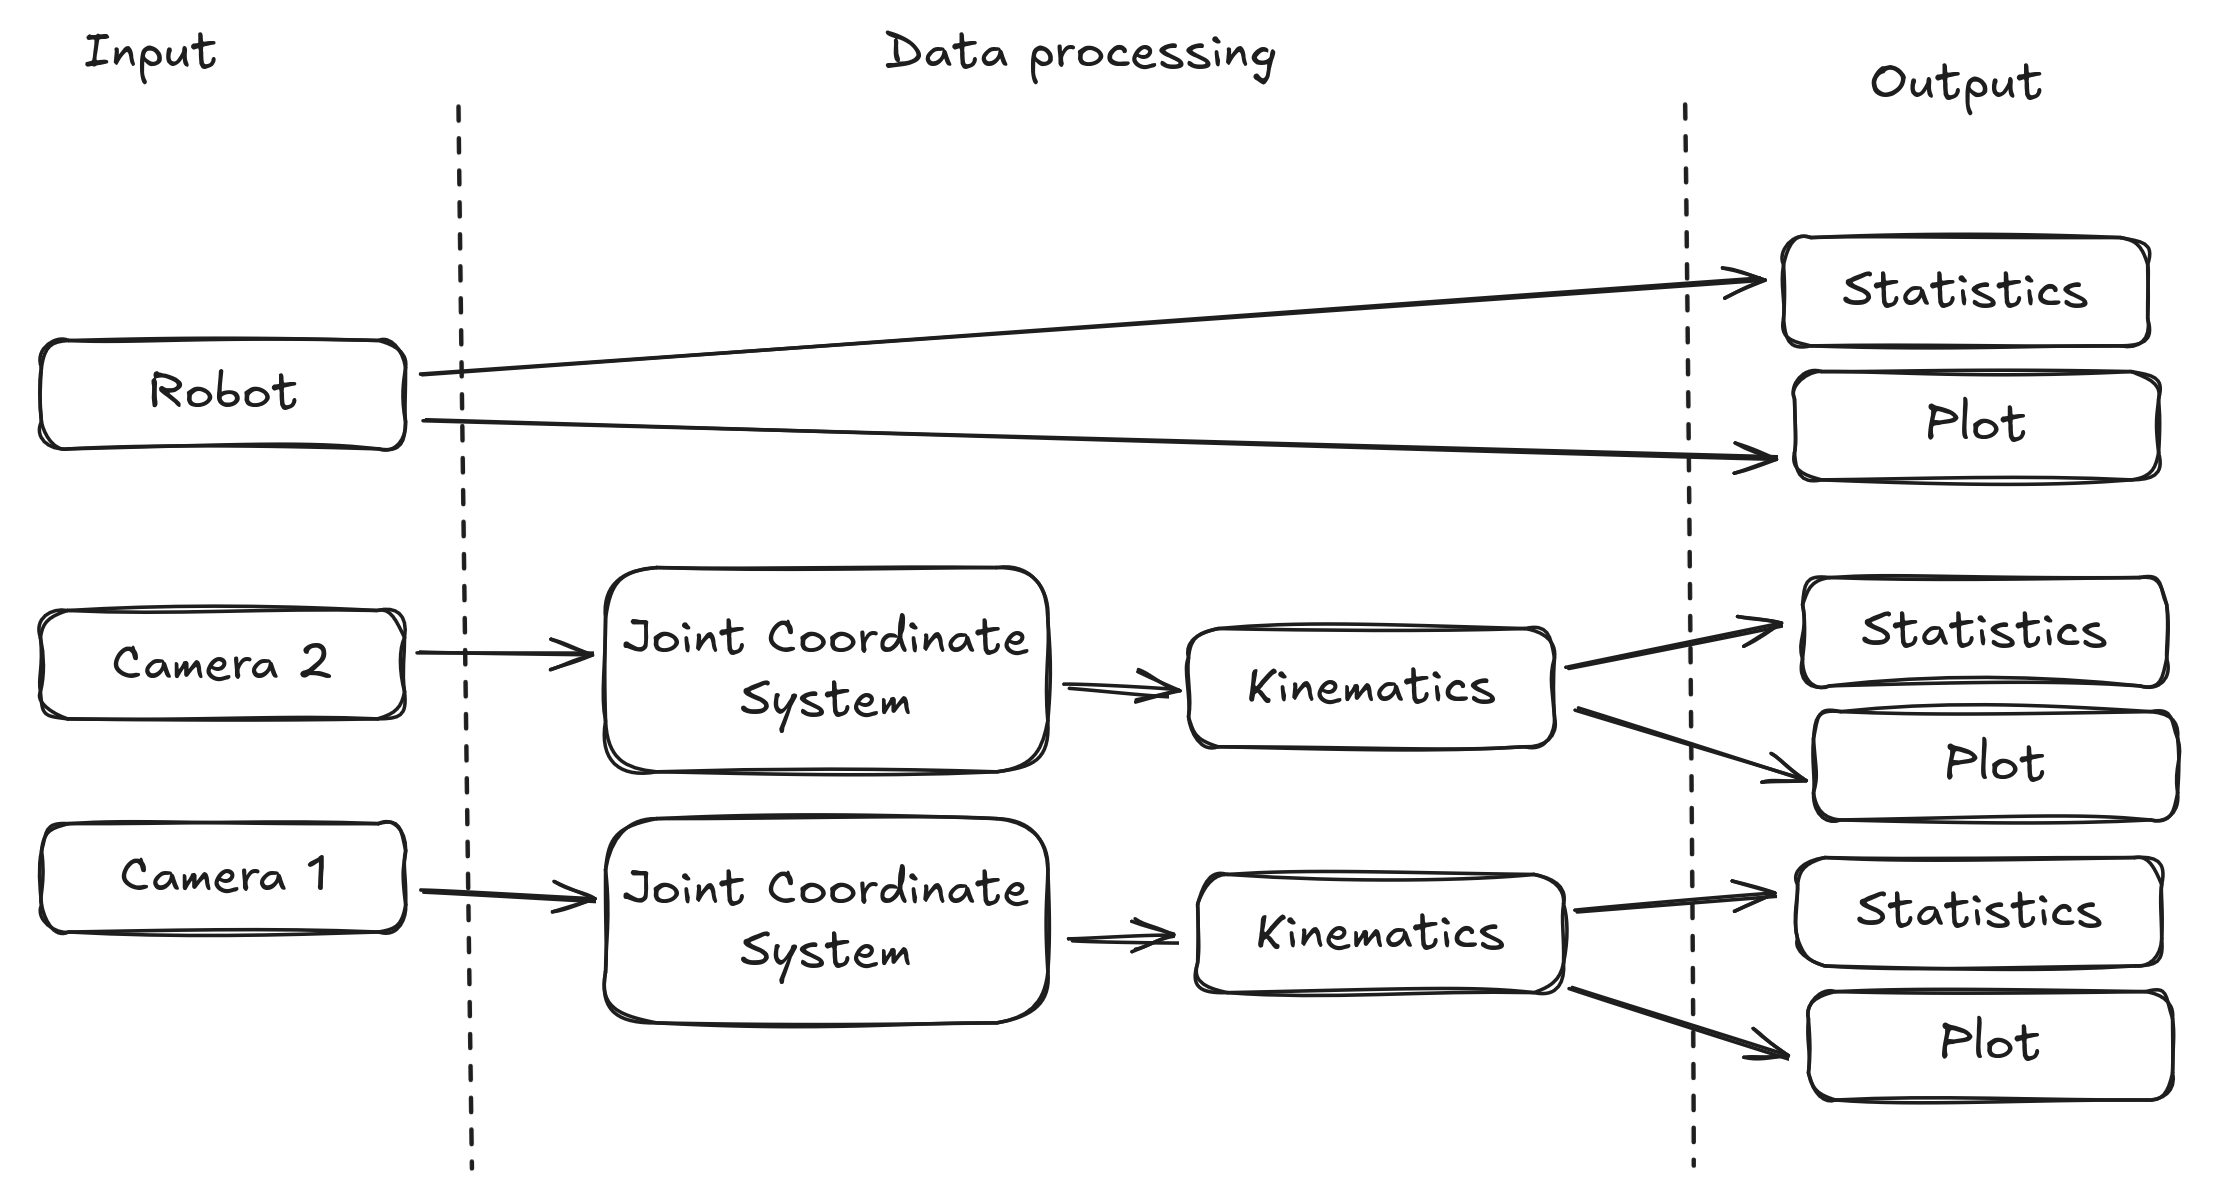
Each section was developed months apart, expanding from a shared base. Organically, they became distinct codebases doing the same thing. This is fairly hard to maintain because over time they diverged. The core code was still the same, but naming conventions changed, features were added or removed, etc. Ultimately, it led to a lot of repeated work -- especially of improvements in one codebase that couldn't easily be ported to the other.
Ideally we would have something more streamlined, more in line with:
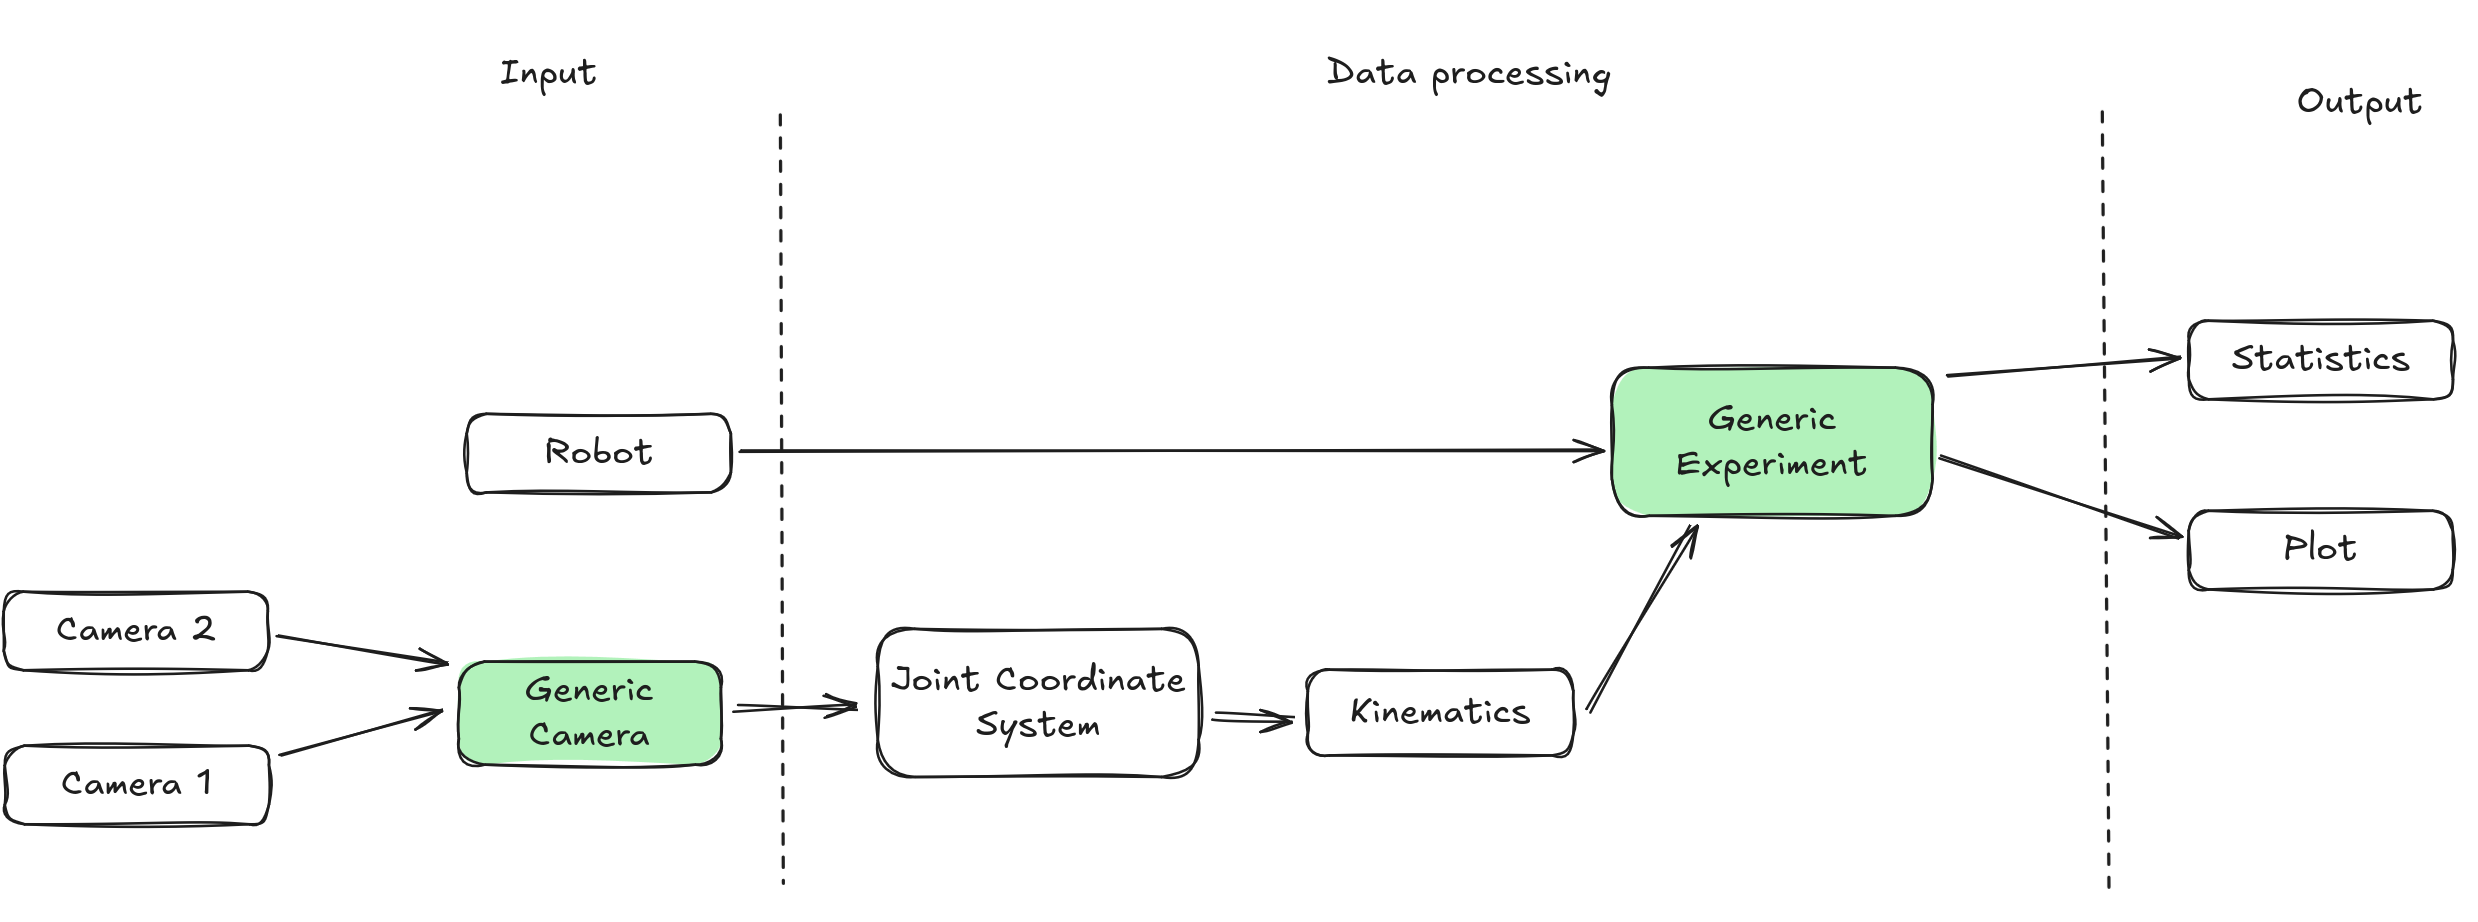
Highlighted in green are the points of the workflow where, if we can generalise the handling of the data, we can significantly reduce complexity.