GUI Implementation for Time Lag Analysis
Overview
This document outlines the implementation of the Graphical User Interface (GUI) in app.py. The GUI provides an interactive front-end for the time lag analysis workflow, allowing users to select data, input parameters, execute calculations, and visualise results. A snapshot is provided in Figure 1. It leverages the CustomTkinter library for modern UI elements and integrates Matplotlib for plotting.
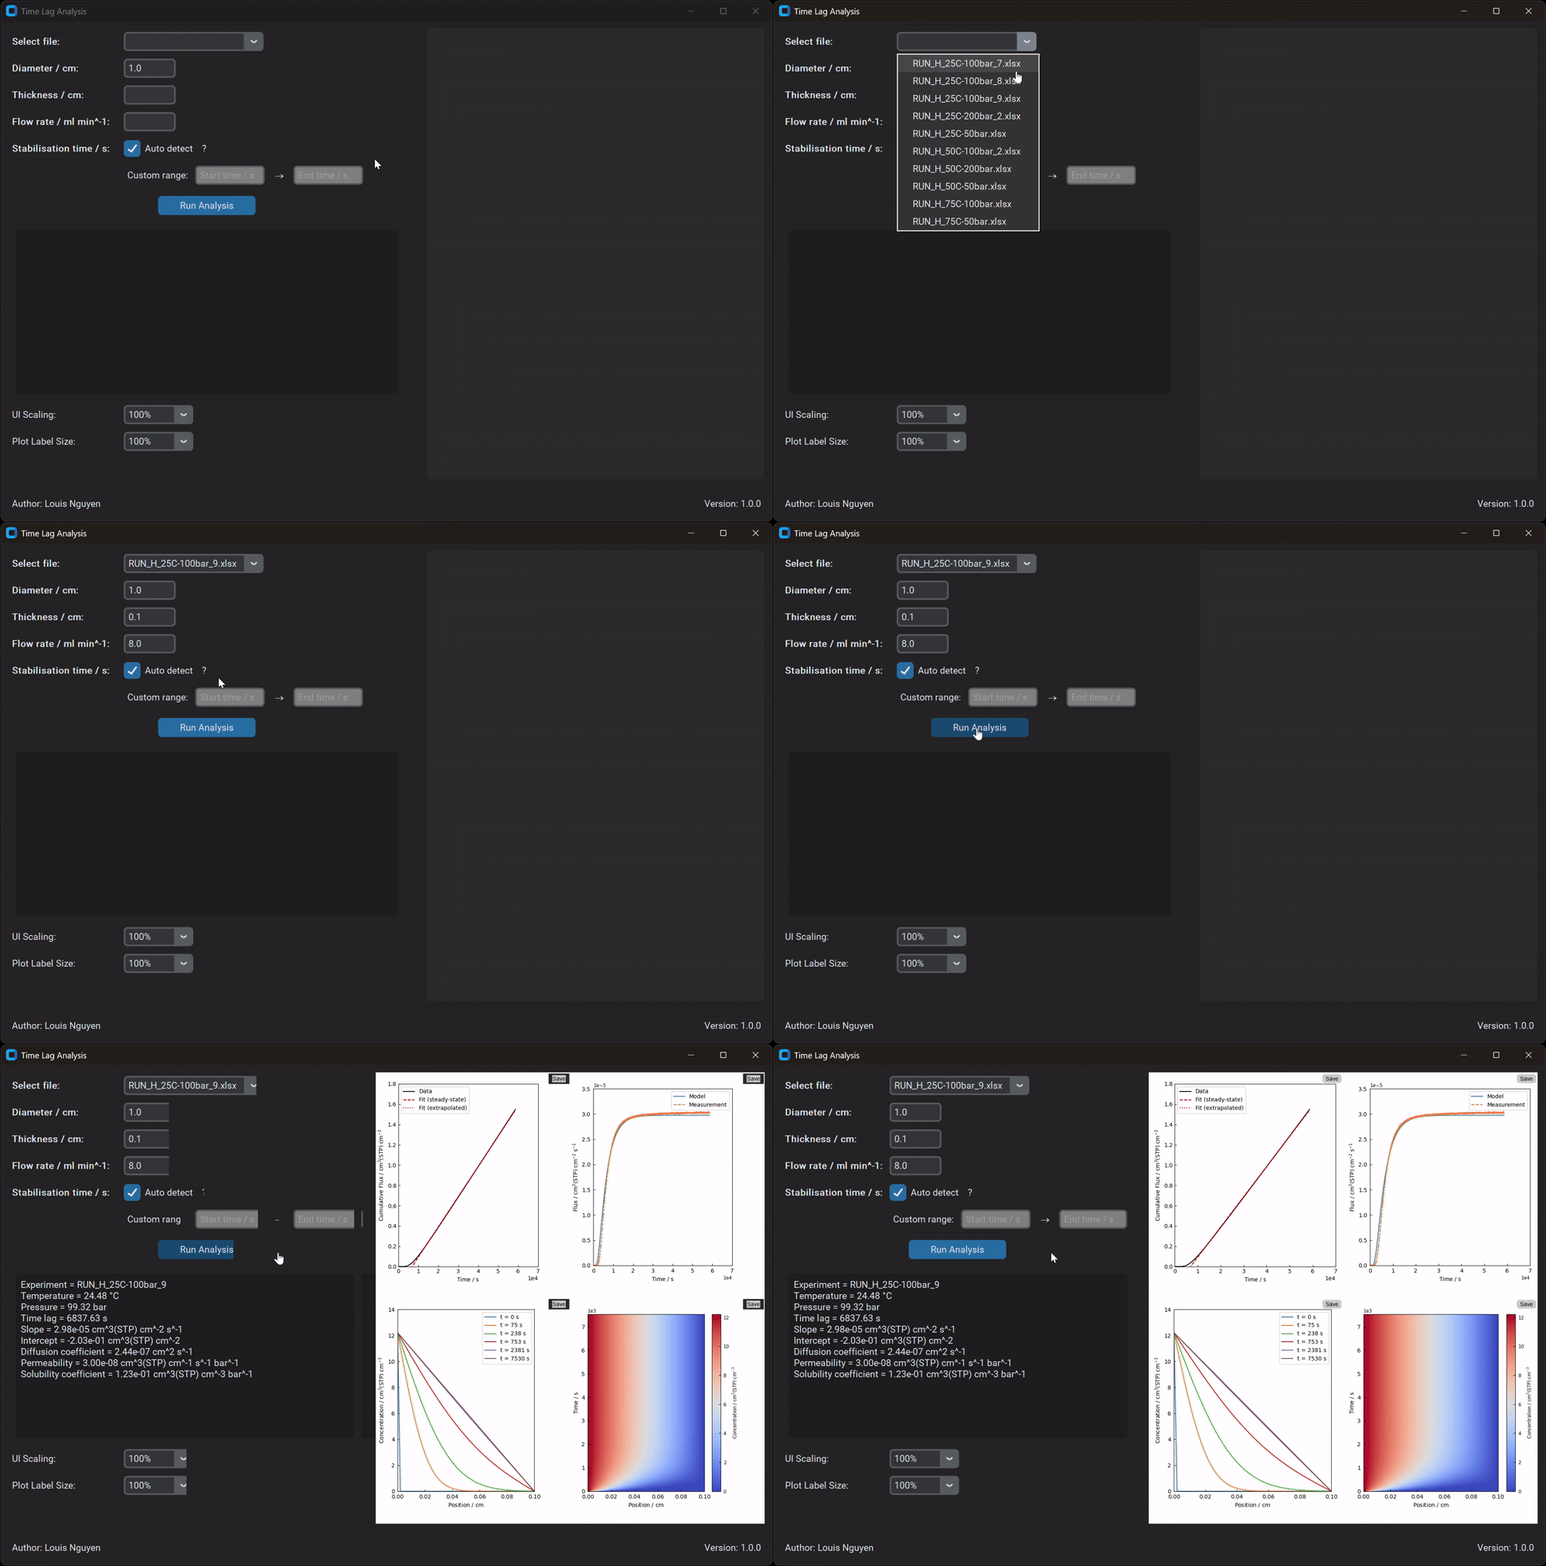
Figure 1: Demonstration of the GUI.
Design Philosophy and Structure
The core design aims for clarity and ease of use, separating user inputs from results visualisation.
-
Framework choice:
customtkinteris a modern UI-library based on Tkinter. It is selected for its modern appearance and theme support, providing a better user experience than standard Tkinter.matplotlibis used for its flexible plotting capabilities, integrated withcustomtkinterviaFigureCanvasTkAgg. -
Layout strategy: The main application window (
Appclass) utilises agridlayout. It's divided into three primary sections:- Input panel (left): Contains all user controls (file selection, parameter entries, buttons) and the numerical results text box (
result_text). This panel occupies less horizontal space. - Plot panel (right): Dedicated to displaying the four key analysis plots. This panel is configured to expand significantly more than the input panel when the window is resized horizontally, ensuring ample space for visualisations.
- Footer (bottom): Displays static information (author, version) and does not expand vertically when the window is resized.
- Input panel (left): Contains all user controls (file selection, parameter entries, buttons) and the numerical results text box (
Designing CustomTkinter Elements
In customtkinter, UI elements (or widgets) are typically instantiated as attributes of the main application class (e.g., self.run_button = ctk.CTkButton(...)).
- Appearance: Configured through parameters (e.g.,
fg_color,font,width) passed during creation or by calling the widget's.configure()method later. - Behaviour: Defined by linking actions to events, often using the
commandparameter (for buttons, checkboxes, etc.) to specify a function to call, or by using the.bind()method for more general event handling.
To position these elements within the window or within container widgets (like CTkFrame), layout managers such as grid or pack are used. For instance, widget.grid(row=0, column=1, padx=5, pady=5, sticky='w') places a widget in a specific row and column within its parent container, adding padding (padx, pady) for spacing, and controlling alignment (sticky). This application primarily uses the grid layout manager.
GUI Components and Logic
The following sections detail the specific widgets used, explaining their configuration and role within the application, following the principles outlined above.
1. Input Panel (input_frame)
This CTkFrame acts as a container, positioned using grid in the left column (column 0) and configured with weight=1 for resizing. It houses the interactive elements for controlling the analysis:
-
File selection (
file_combobox):- A
CTkComboBoxwidget, populated by scanning thedata_dir(get_xlxs_files). - Its
commandparameter is set toon_combobox_selected, triggering autofill logic when a new file is chosen. - Positioned within the
input_frameusinggrid.
- A
-
Parameter input (
d_cm_entry,L_cm_entry,qN2_mlmin_entry):- Standard
CTkEntrywidgets for essential experimental parameters. Their appearance (e.g., width) is set during instantiation. - Default values are provided for convenience.
- Positioned using
grid.
- Standard
-
Stabilisation time configuration:
- A
CTkCheckBox(use_custom_stab_time_checkbox) allows switching between automatic detection (default) and manual input. Itscommandparameter links totoggle_custom_stab_time_entries. - The
toggle_custom_stab_time_entriesmethod enables/disables the 'Start time' and 'End time'CTkEntrywidgets (contained within a separateCTkFrame) based on the checkbox state, modifying theirstateconfiguration. Visual cues (graying out) indicate the disabled state. - A
CTkLabel(help_label) provides a tooltip (show_tooltip) explaining the auto-detection logic, using event binding (bind) for hover detection. - All elements are positioned using
grid.
- A
-
Execution (
run_button):- A
CTkButtonwhosecommandparameter is linked to the mainrun_analysismethod. - Positioned using
grid.
- A
-
Results display (
result_text):- A
CTkTextboxused to display formatted numerical results. Its content is updated programmatically withinperform_calculations. - Positioned using
grid.
- A
-
Scaling controls (
scaling_combobox,label_scaling_combobox):CTkComboBoxwidgets allowing users to adjust UI and plot label scaling.- Their
commandparameters link tochange_scalingandchange_label_scalingrespectively. - Positioned using
grid.
2. Plot Panel (plot_frame)
This CTkFrame displays the graphical results, positioned using grid in the right column (column 1) and configured with weight=4. This higher weight (compared to the Input Panel with weight=1) ensures it expands more significantly than the input panel during horizontal resizing:
- Plot integration:
matplotlibfigures are embedded within individualCTkFramewidgets usingFigureCanvasTkAgg. The canvas widget obtained fromFigureCanvasTkAggis then positioned usinggridwithin its container frame. - Layout: The container frames for each plot are arranged in a 2x2 layout within the main
plot_frameusinggrid. - Plot Generation: Plots are created by functions in
visualisation.py(e.g.,plot_time_lag_analysis) using data stored inself.calculation_results. Theupdate_plotsmethod handles embedding these figures. - Interactivity: Each plot's container frame includes a 'Save'
CTkButton. Itscommandis configured (using alambdafunction to pass the specific figure) to open a file dialog (ctk.filedialog.asksaveasfilename) for exporting the corresponding figure.
3. Core Interaction Workflow (run_analysis)
The run_analysis method orchestrates the main application flow, triggered by the run_button:
-
Trigger: Initiated by the "Run Analysis" button's
command. -
Calculation (
perform_calculations):- Retrieves input values (file path, parameters, stabilisation time choice) from the UI widgets using their
.get()methods. - Performs basic validation.
- Calls the backend
time_lag_analysis_workflowfunction fromtime_lag_analysis.py(detailed in08-Application-Workflow). - Stores the returned results in
self.calculation_results. - Formats and displays numerical results in the
result_textbox by configuring its content.
- Retrieves input values (file path, parameters, stabilisation time choice) from the UI widgets using their
-
Plotting (
update_plots):- Called after
perform_calculationsor when plot label scaling changes (vialabel_scaling_comboboxcommand). - Clears any existing plots from the
plot_frame. - Generates the four plots using data from
self.calculation_results. - Applies the current label scaling factor.
- Embeds each plot figure and its associated 'Save' button into the
plot_frameusinggrid.
- Called after
This structure ensures that calculations are performed first, and the results are then used to update both the numerical display and the graphical plots by configuring the relevant widgets.
Data Flow within the Application
The GUI facilitates a clear flow of data from user input to final results:
-
User input collection: When
run_analysisis triggered, values are read directly from UI widgets:self.file_combobox.get()-> Selected data file path.self.d_cm_entry.get(),self.L_cm_entry.get(),self.qN2_mlmin_entry.get()-> Experimental parameters (converted to floats).self.checkbox_var.get()-> Determines stabilisation time mode (auto/manual).self.stab_time_start_entry.get(),self.stab_time_end_entry.get()-> Custom time range (if manual mode).
-
Backend processing (
perform_calculations):- The collected inputs are passed to
time_lag_analysis_workflow(fromtime_lag_analysis.py). - This function performs the core scientific calculations (data loading, processing, regression, parameter calculation).
- It returns a dictionary (
results_dict) containing numerical results and potentially pandas DataFrames.
- The collected inputs are passed to
-
Result storage: The returned
results_dictis stored in the application's state variableself.calculation_results. -
Output display:
- Numerical:
perform_calculationsformats key values fromself.calculation_resultsinto a string and updates theself.result_textwidget. - Graphical (
update_plots): Theupdate_plotsfunction accessesself.calculation_results(specifically the DataFrames and calculated parameters) and passes them to the plotting functions invisualisation.py. The generatedmatplotlibfigures are then displayed in theplot_frame.
- Numerical:
This flow ensures separation between the UI layer and the calculation logic, with self.calculation_results acting as the bridge.